
P14 Weekly Screen #8 - Logistics
The cycle is turning. Are you well positioned? - P14’s 5 picks with mini-theses

Greetings.
For newer subscribers, P14’s weekly (or bi-weekly when I’m working on a single-stock thesis) screen is a hybrid (free & paid) product where I explore a theme that looks attractive to me. The rationale for why I’m interested in a theme, or my broad thematic thesis, is typically free. Under the paywall, I provide a curated list of stocks, each with a mini-thesis outlining why they should benefit from the broader theme alongside idiosyncratic factors that could turbo-charge returns.
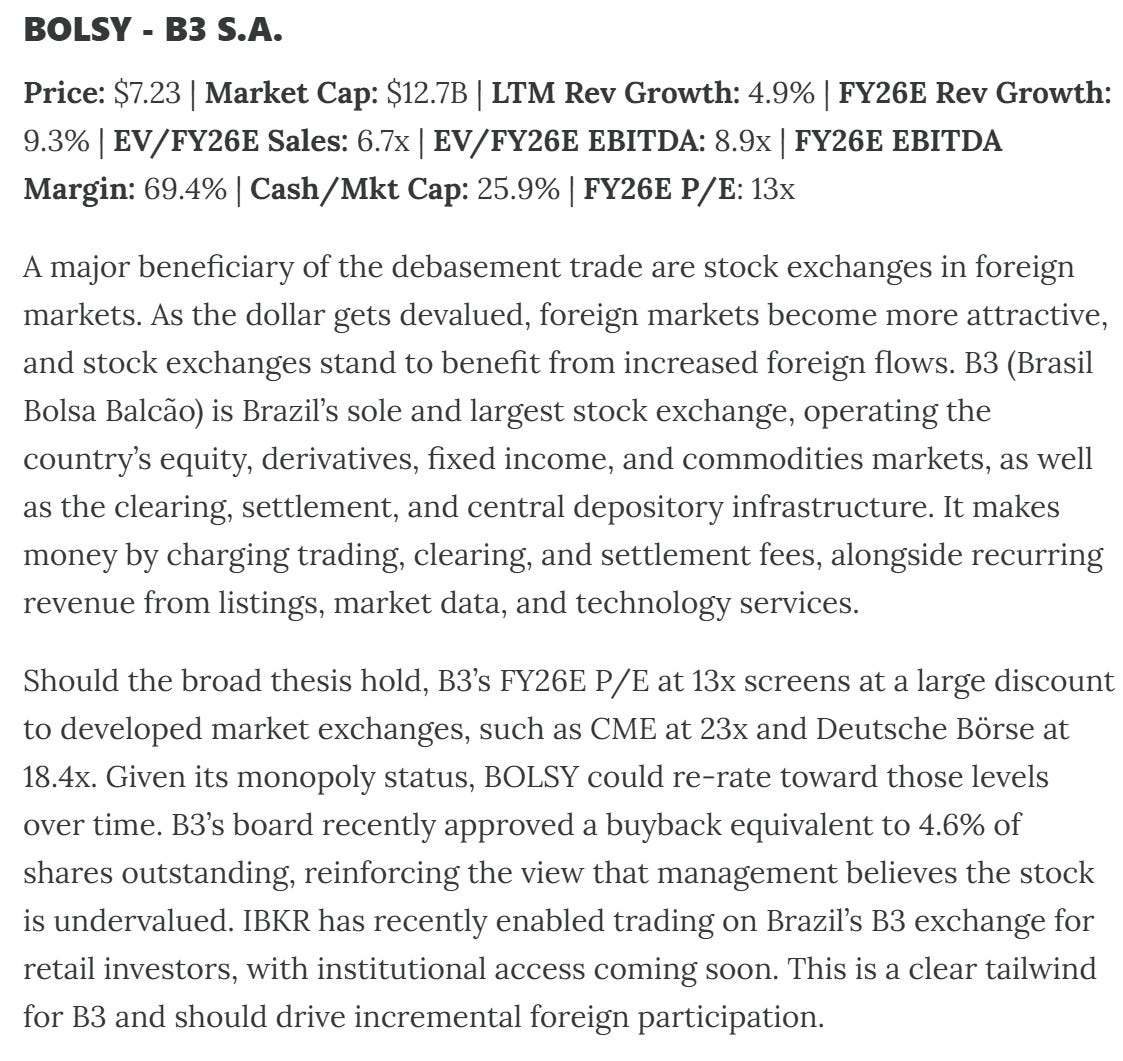
A good example of this is the recent P14 Brazil screen. As a preview of what sits behind the paywall, my top pick in Brazil, $BOLSY, is already up 16.3% since the pitch date.

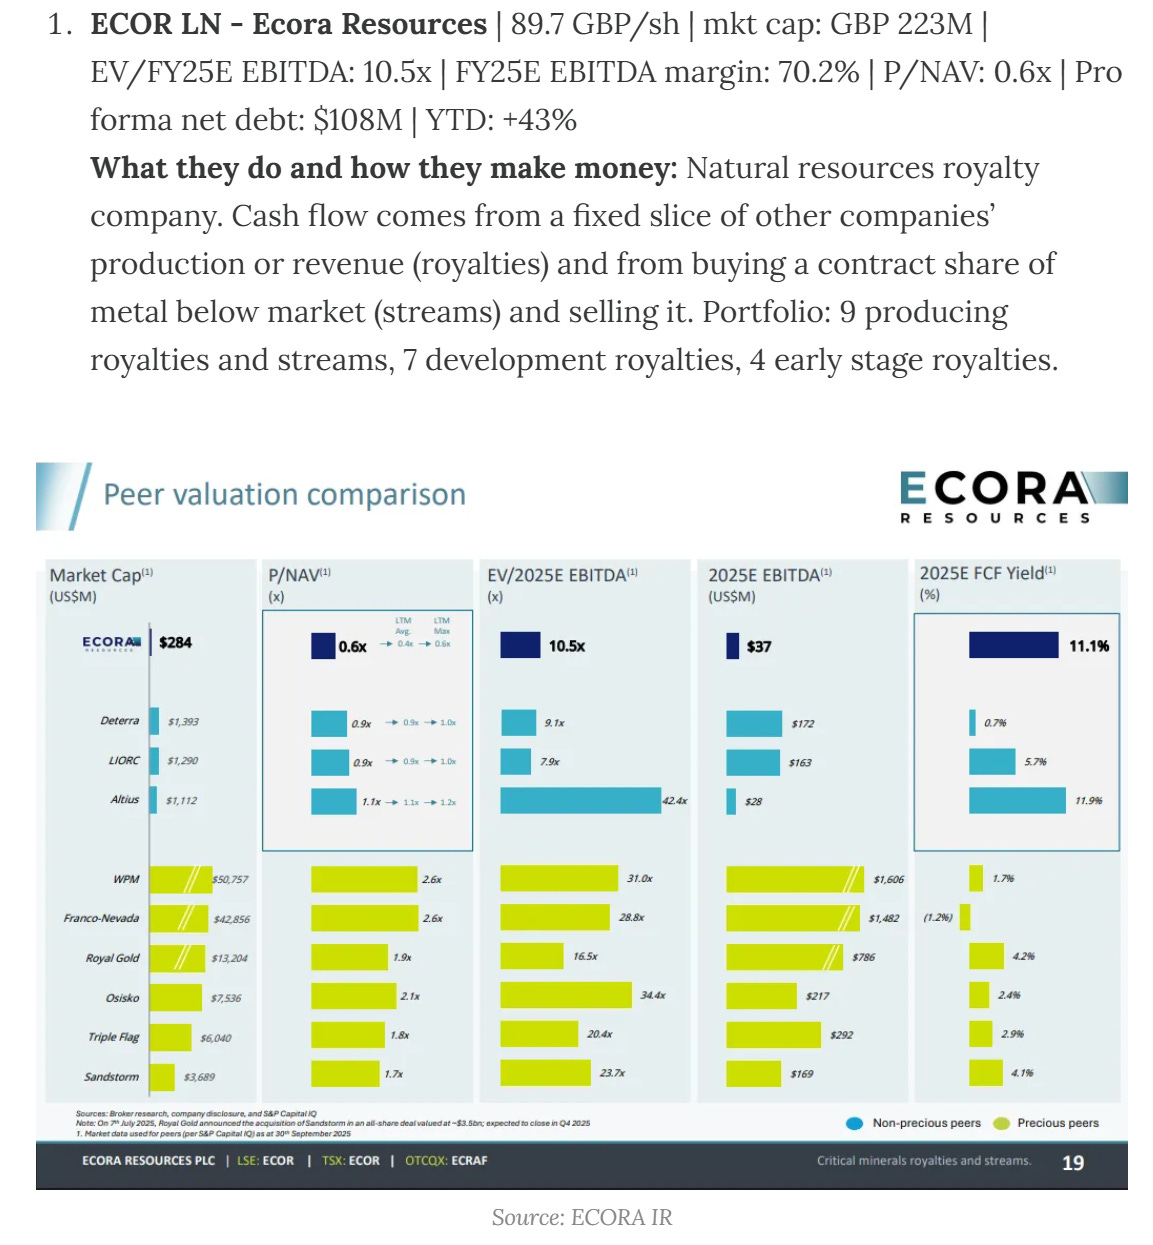
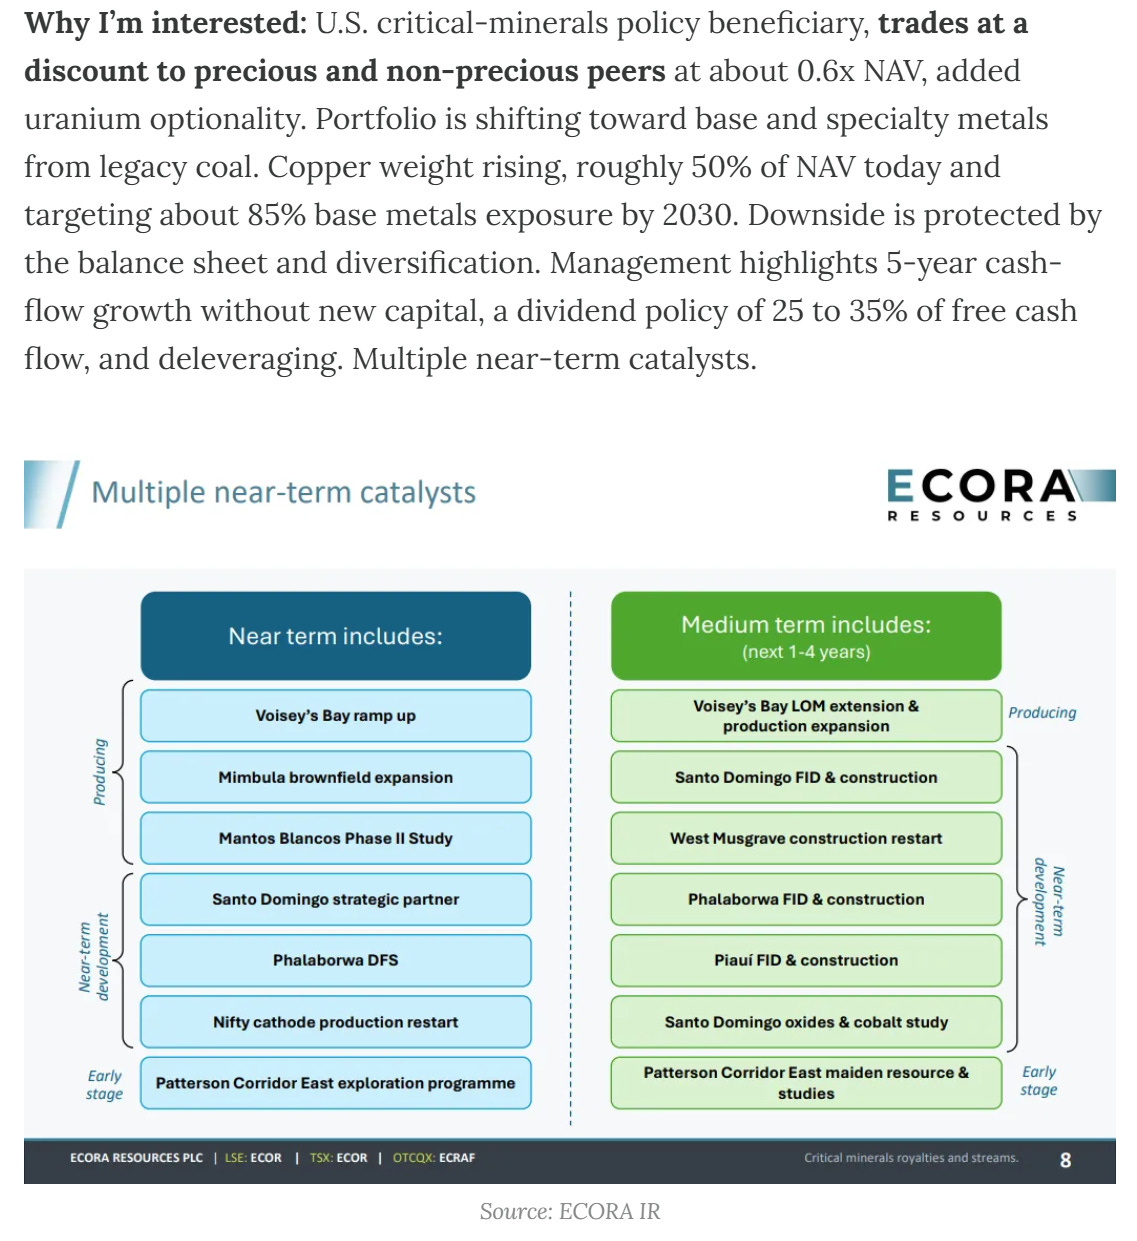
Another banger of an example is the P14 Copper screen, where my top pick, Ecora Resources, is up 44% since the pitch date (I own the CAD listing here, +46%).

Screens help me, and hopefully you (if you decide to subscribe), stay ahead of emerging themes and position you and I in the greatest beneficiaries. 2025 was a thematic year, to say the least, and nothing stops this train in 2026, the cycle will turn to new themes, and the sun will rise again…
With that said, I present you with the turning cycle in logistics.
It almost feels like the “logistics recession” has been going on forever since COVID. After supply chains were pummeled during the pandemic and then recovered strongly during the post-COVID demand boom in 2021, only to be hit again by the inflation shock in 2022, the logistics market has yet to recover to its pre-COVID levels, with the downside recently fueled further by tariffs in 2025.
Fast-forward to today, tariff rates have broadly stabilized, and with affordability a prime focus heading into the midterms, there is credible reason to believe that tariff rates may decline. I have discussed my reasoning in my consumer discretionary thesis, which you can see here:

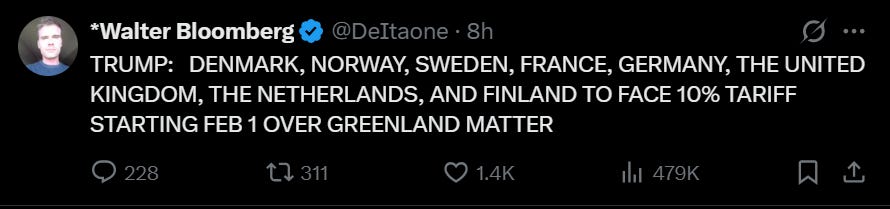
Note that in my view, the recent “Greenland tariffs” are a negotiating chip and are unlikely to matter materially, especially in light of the upcoming Supreme Court decision. If ruled against, country-level tariffs would likely be overturned and replaced with sectoral tariffs, likely with a time lag. In my view, sectoral tariffs are a more difficult tool to deploy and even harder to sustain in a midterm year from a broad policy perspective. For instance, no one wants to be seen tariffing toys in a midterm year. In any case, the only countries that really matter on this list are Germany and France, which make up 4.4% and 1.9% of YTD imports, respectively. That said, any retaliation by the EU bloc would likely lead to short-term downside in the market, and the same dynamic, but amplified, for logistics stocks. Rest assured, P14 will be there to buy the dip (nothing ever happens, until it does, but I don’t think that’s now).
To be clear, this broad thesis primarily applies to the U.S. logistics market. More specifically, the theme outlined in this post applies to only a few subsectors that I am bullish on for 2026. Logistics is a large and circular market, so it helps to stay focused. Much of the broad thesis applies to the trucking market, as truckload carriers are first in line to benefit from domestic cycles, as evidenced by the run major truckload stocks have had from late 2025 to date. The second-order beneficiaries, which in my view have MUCH MORE UPSIDE remaining, sit under the paywall.
The trucking market
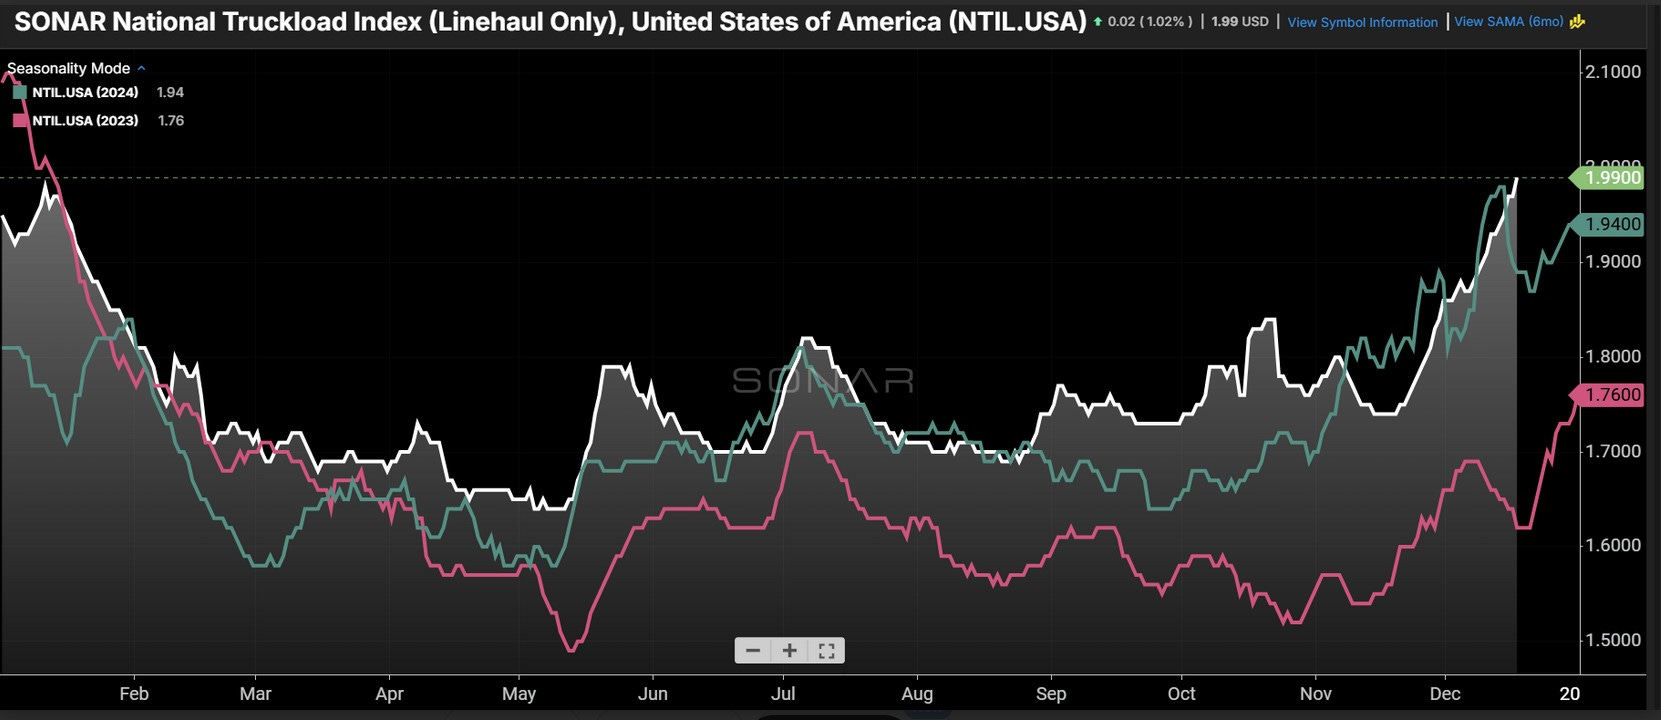
The broad bullish thesis in trucking centers on rising spot rates. The industry entered a boom shortly after COVID as consumer goods spending surged, pulling in a wave of new carriers chasing elevated pricing. By mid-2022, inflation dampened demand, and the excess supply capacity built during the boom collided with weaker volumes, sending spot rates sharply lower.
For context, spot rates represent the price paid for a load today and fluctuate with supply and demand. Contract rates are fixed-price agreements between shippers and carriers, typically negotiated months ahead. In a healthy freight market, contract rates exceed spot rates, compensating carriers for reliability and guaranteed capacity. Between 2022 and 2025, spot rates fell materially below contract rates, incentivizing shippers to abandon contracts in favor of cheaper spot pricing, which further exacerbated the downturn.
By early 2026, the industry had endured 14 consecutive quarters of weak demand, compressed margins, and withering balance sheets. That dynamic has started to change. Since late 2025, spot rates have begun to recover, and the gap between spot and contract pricing has started to narrow:
Naturally, the market, being smarter than all of us, has already started to price in rising spot rates as a positive for the largest truckload companies such as ODFL (LTL), JBHT (TL), and KNX (TL), with the group up ~35% on average since mid-November.
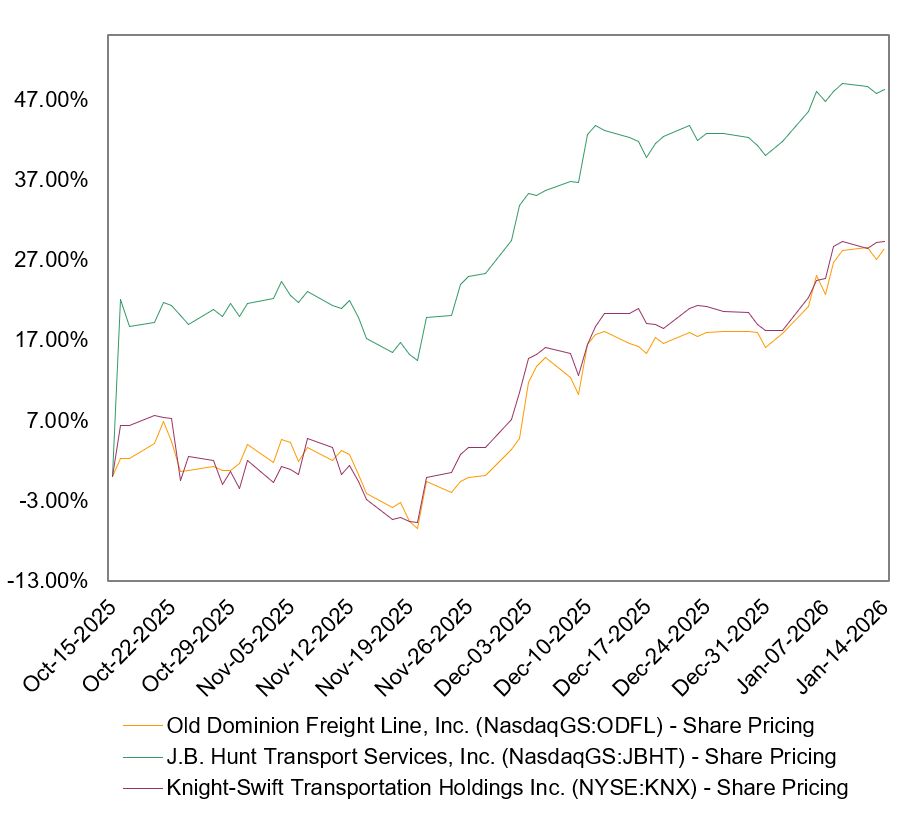
At the surface, it may appear that missing a 35% rally means it is “too late,” especially in a cyclical industry like trucking. However, major truckload carriers are typically the first to move in a rising spot rate environment. There are many companies that stand to be direct beneficiaries of this move and still have room for multiples to expand to cyclical highs, but I will leave that as motivation for you to subscribe and view my 5 picks under the paywall. Nevertheless, back to what I was saying, trucking companies still have a lot more room to run, and a true valuation peak has not arrived yet.
This view primarily arises from what is actually driving the spot market currently and what will add more fuel in the coming months. The current move is largely capacity driven.
Supply-side drivers
In simple terms, the recovery in spot prices reflects a supply-side contraction driven by the exit of excess capacity. High operating costs combined with a multi-year demand downturn, have forced a meaningful number of small and mid-sized carriers out of the market. Those still operating, particularly smaller carriers with strained balance sheets after 14 quarters of pressure, cannot afford to expand fleets despite higher spot pricing. The overwhelming majority of trucking companies in the U.S. are small, independent businesses. 91.5% of all carriers operate 10 or fewer trucks and 99.3% of all carriers operate fewer than 100 trucks. Large carriers only control about 20-25% of the total truck population.
One of the most visible supply-side indicators is the tender rejection rate, which measures the percentage of contracted truckload tenders that carriers reject at agreed pricing. Seasonally, tender rejection rates spike in December due to weather. That played out in late 2025, with rates exceeding 12.5%. What matters more is what ensues in January. Tender rejection rates typically fall sharply during January due to weak volumes. But this year, rates have remained above 10% despite soft demand. SONAR’s truckload rejection index stands at 10.2% versus 7.3% a year ago, when volumes were materially stronger in January 2025.
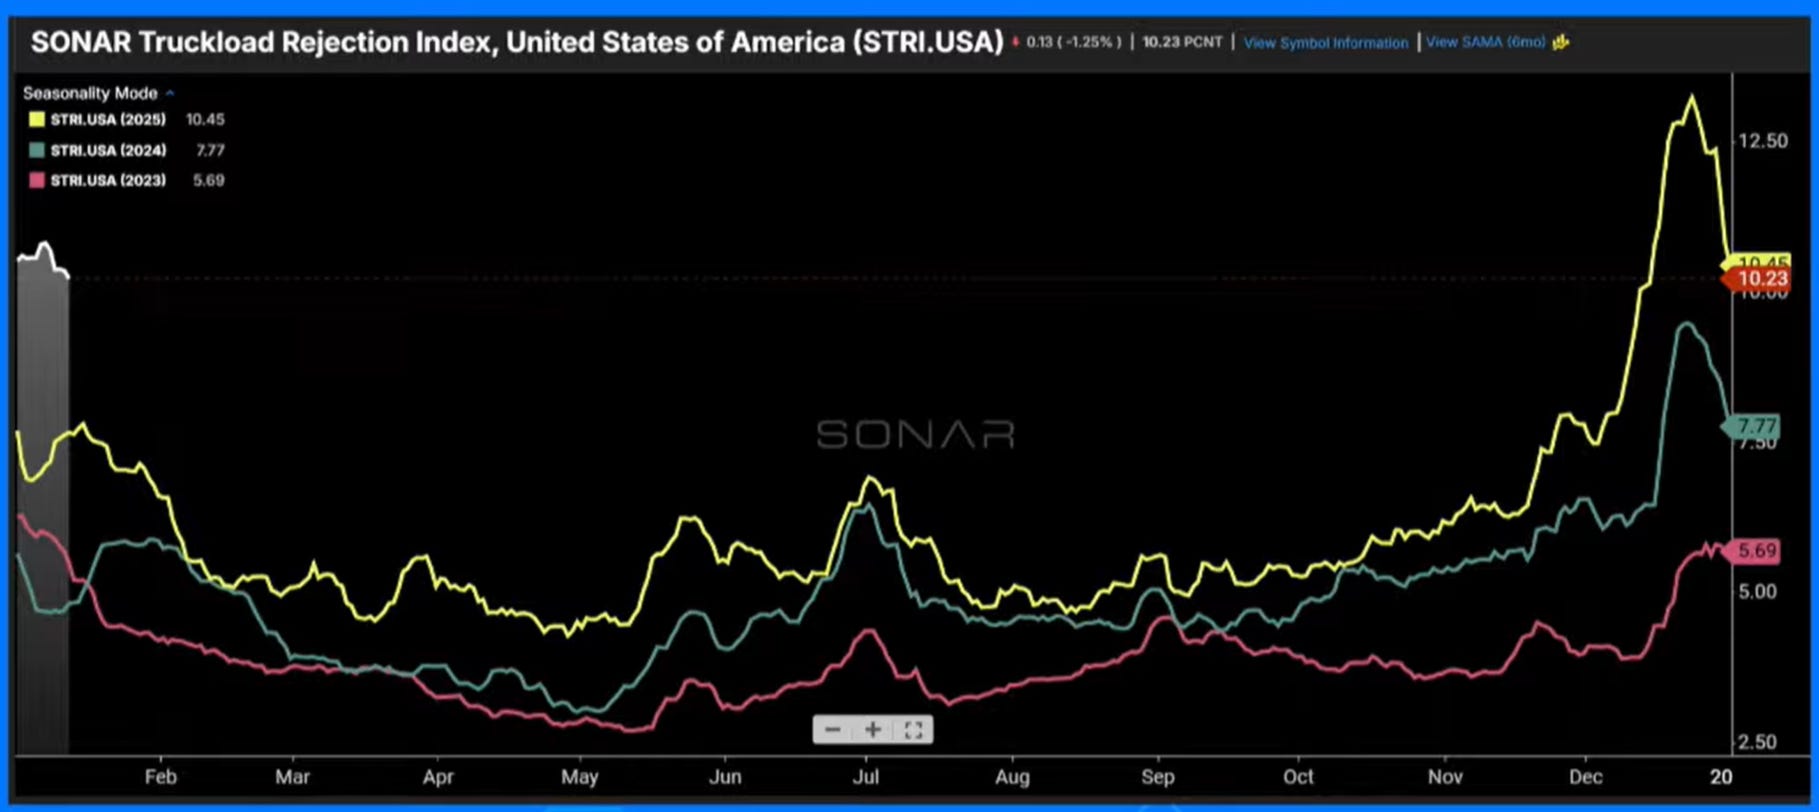
This persistence in tender rejection rates indicates the market has lost a meaningful amount of capacity and has become more vulnerable to disruption from weather events, spot surges, or routing guide failures.
Another supply-side constraint is immigration. Incremental immigrant labor was a major source of capacity over the last ~3 years. That dynamic has now reversed. Increased enforcement through English language proficiency standards and entry-level driver training requirements has tightened the labor pool. Research from Trucking Dive suggests some states could see 15–25% reductions in CDL holders tied to immigration-related policies.
Small and mid-size carriers lack the financial flexibility for meaningful pay increases or fleet expansion, and labor availability is now tight, increasing barriers to entry.
These supply-side dynamics are beginning to be priced into valuations. In the P14 view, there remains room for multiples to expand on supply-side dynamics alone, with demand-side drivers adding further upside in 2026.
Demand-side drivers
Tariff stability is critical for logistics in 2026 (ex-the recent Greenland debacle, lol). The uncertainty seen last year disrupted inventory planning and freight flows, and even if tariff rates remain elevated, which appears unlikely given affordability considerations in a midterm year and the ongoing Supreme Court decision, the logistics market can at least rely on a more stable year relative to what was seen in 2025.
The demand picture is also improving, as reflected in the latest Logistics Manager Index reading, which is typically seen as a forward indicator of logistics conditions 3–6 months ahead.

The December 2025 LMI highlighted several data points supportive of a constructive 1H26 outlook, with transportation capacity remaining tight while early demand signals begin to emerge.
For one, we must commend U.S. retail supply chain managers for executing well in a year of immense uncertainty. Inventory levels collapsed in December to one of the lowest readings on record for the inventory index, implying that the rate of inventory drawdown over the course of the month was historically fast. This suggests that inventory levels at retailers are now effectively depleted, and given that the holiday shopping season drove this drawdown while still showing signs of a resilient consumer, inventory ordering is likely to return, as retailers cannot keep shelves empty indefinitely. This marks the end of inventory hoarding and sets up replenishment cycles in 2026. Even with the wait-and-see approach retailers may adopt in light of renewed “Greenland tariff” uncertainty, it is reasonable to assume that shelves will not remain empty.
This inventory dynamic is also reflected in warehouse utilization, which fell to an all-time low in December and remained negative for 2 consecutive months, suggesting that inventory is moving through warehouses quickly and validating the just-in-time strategies many retailers focused on in 2025. Warehousing pricing has also begun to rise, indicating that facilities are constrained by labor and are preparing for an increase in inbound volumes as ordering cadence normalizes.
At the bottom line, inventory will need to be restocked. The key question is how much volumes can rebound. Companies remain cautious and in a wait-and-see mode, continuing to run lean inventories under JIT inventory methods.
In the P14 view, the inflection occurs as inventories reach lean levels and even modest increases in consumer demand force replenishment, which could push spot rates higher faster than expected in the 2H26. In my view, demand improvement begins as early as 1H26 with a stimulated consumer, consistent with my consumer discretionary thesis outlined earlier.
2026 will be the year with the highest level of tax refunds in history, with no tax on Social Security and no tax on tips. Estimates vary, but we are looking at >$150B in tax refunds for the 2025 tax year arriving in 1H26. This is a dynamic not seen in prior years, and it can be said with a reasonable degree of confidence that this will lead to incremental purchasing power, especially for the low-income consumer that has been constrained post-COVID after stimulus ran out.
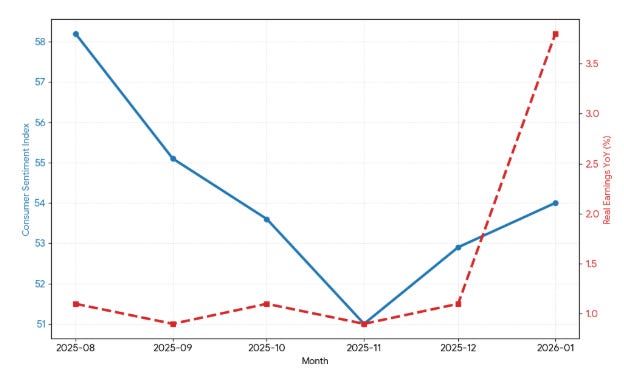
Even before these refunds hit, we are seeing signs of a healthier consumer, as evidenced by improving consumer sentiment since the shutdown ended and real earnings growth alongside tame inflation and minimum wage hikes. The bottom line is that consumers are going to have more money to spend in 1H26, and that money is going to find its way into logistics volumes.
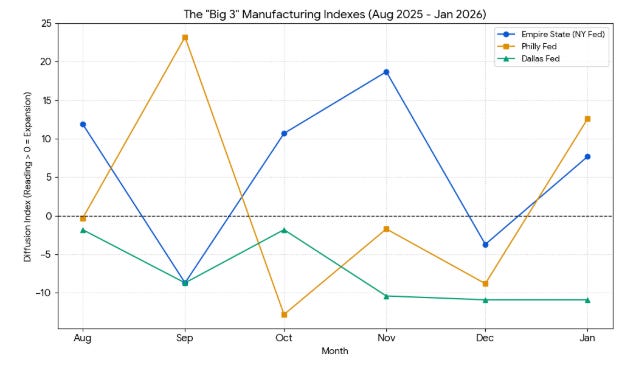
Consumption is an important component in gauging the cyclical recovery in logistics, but manufacturing may be even more important. We are now seeing a strong reversal in real-time manufacturing indexes from the Empire State and Philly Fed, with both reversals driven more by new orders and shipments rather than pricing, which points to a constructive environment for trucking.
Empire State: The Shipments Index rose by 21 points to 16.3, its highest level in over a year, New orders also flipped from negative to positive 6.6. Philly Fed: The New Orders Index jumped 9 points to 14.4, and shipments rose to 9.5.
Interestingly, as reflected in the LMI, both regions reported inventory levels at their lowest in years, and when inventories are lean while orders are rising, supply chains revert to just-in-time behavior, which typically increases reliance on expedited shipments and spot market usage due to the absence of safety stock. Texas data will be released later in January, but expectations are similar.
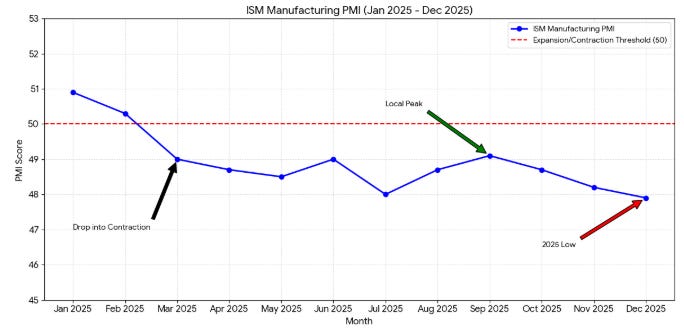
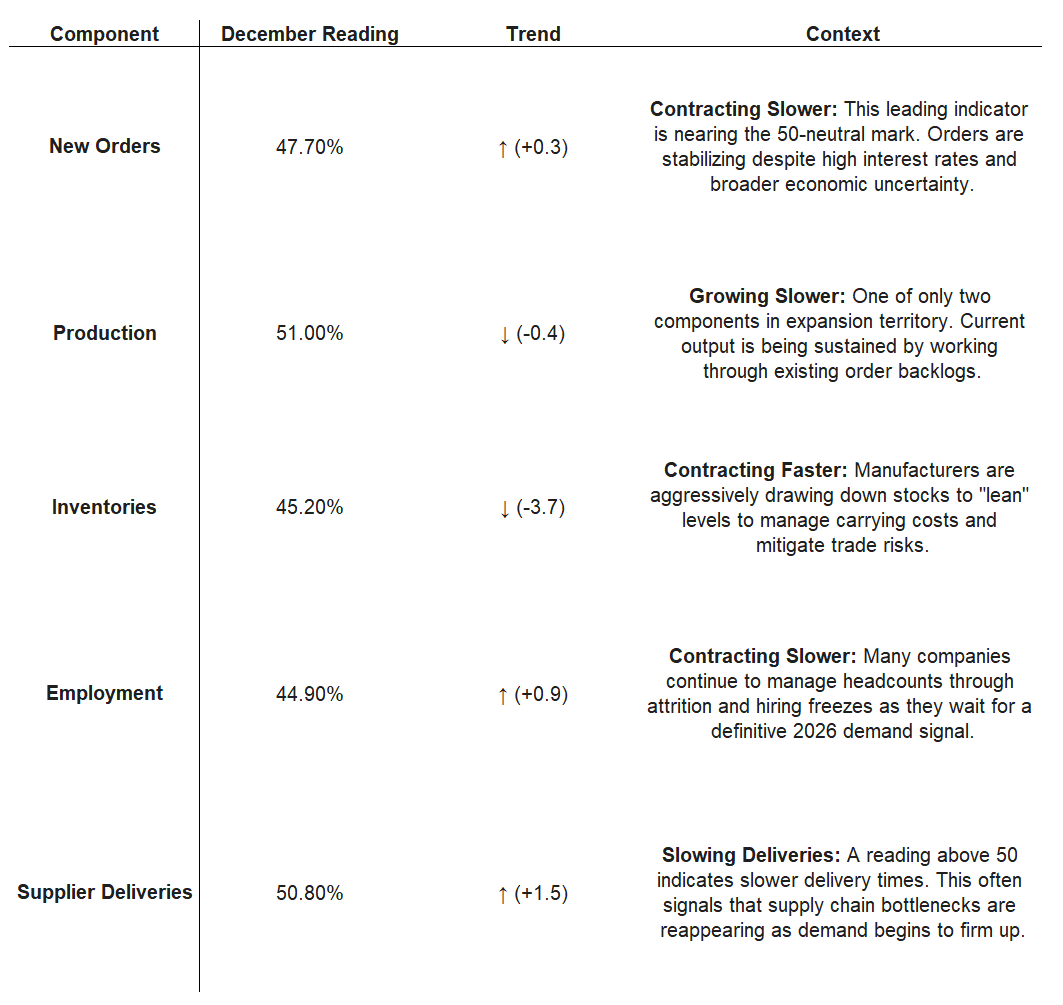
While state-level indexes are pointing to optimism, the consolidated ISM Manufacturing PMI is pointing to a never-ending contraction, now extending to 10 months of contraction. Though the headline indicates a "faster rate" of contraction, the internal components tell a more nuanced story of a sector bottoming out (see above). Note: the ISM focuses on large, multinational corporations. The NY/Philly surveys include more small-to-midsize domestic firms. While both are leading indicators, the ISM is based on surveys from the previous month (December). The NY and Philly surveys were collected between January 5 and January 12, 2026. They are literally the most “real-time” data we have.
Outside of retail, where consumer purchasing power serves as a proxy, and manufacturing, the logistics sector remains closely tied to the cyclical physical economy. Chemicals are a clear example, as the sector is showing signs of recovery, with shares of major chemical producers moving in lockstep with improving expectations, a pattern also seen across other cyclical industries.
Housing and residential construction are also meaningful drivers of freight demand in the U.S. With mortgage rates expected to decline this year, the consensus view is for homebuilding activity to recover. As is often the case, the market has begun to price this in, with homebuilding stocks already reflecting improving expectations, supported by policy tailwinds.
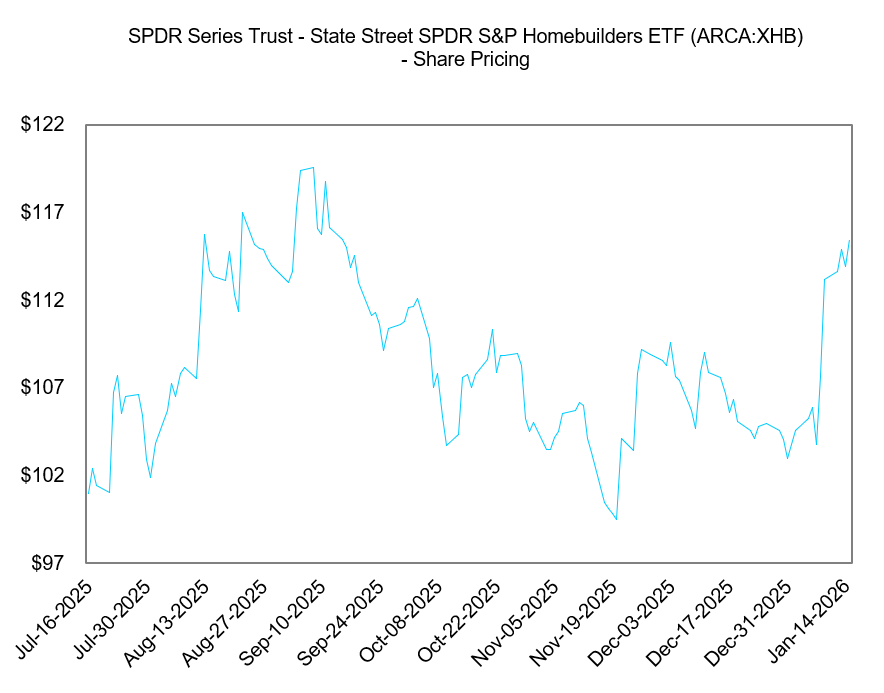
Downstream categories tied to housing are also improving. Furniture tariffs are easing, and other housing-related inputs are recovering, which has direct downstream effects on logistics volumes. While housing starts were sluggish in October at 1.25M, consensus expectations point to improved construction activity as mortgage rates decline further into next year.
Valuation context
This is a cyclical industry, so current valuations should not be compared to cyclical troughs but rather to what they could look like in an up-cycle. The most recent up-cycle was the post-COVID boom in late 2020–2021, which is an unsustainable benchmark for multiple comparisons given the outsized demand recovery. That said, the current stimulus in the form of tax refunds is estimated to translate to ~$800 per person, and the freight recession has lasted for more than 3 years. I am not suggesting 2026 will look like 2021, but there are some shared characteristics to a limited degree. 2026 will surely look more like 2021 in the event of a $2,000 “tariff dividend”, which in my view, while unlikely, is not impossible to expect in an election year.
Looking next at 2018, while the spot market had a strong year, logistics equities underperformed due to inflationary pressures, capex overload tied to e-commerce investments, and insufficient demand growth to offset costs.
The last more normalized up-cycle for logistics was in 2017, when manufacturing PMI readings improved in Q1 and Q2 and the spot market followed later in the year amid natural disasters. In 2026, demand recovery and supply contraction are occurring at the same time. From a valuation perspective, this allows for a comparison between P/E multiples at the end of 2017 and current consensus P/FY26E EPS. For simplicity, I focus on the 4 largest U.S. truckload carriers.
The reason I focus on truckload names is that they tend to move first in any up-cycle, as they are first in line to benefit from rising spot rates and improving demand, which explains why most of the names referenced below are already up YTD.
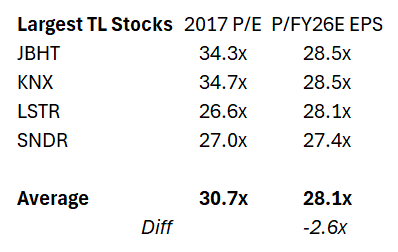
As shown in the table above, even within the truckload market, which increasingly reacts first to changes in supply-demand dynamics, the average P/E on FY26E normalized EPS still trades at a ~2.6x discount to 2017 levels. This suggests there is still upside for the largest truckload names before reaching what was seen in the last “normal” peak cycle.
Recent developments
Logistics is an industry where economic data tied to the consumer and manufacturing has a direct impact on equity returns. Earnings reports from the largest companies often act as bellwethers for the sector. JBHT, the first truckload carrier to report, released 4Q25 earnings on 01/15/2026 (Thursday after close), and this report drove much of the downside seen across logistics stocks the following day, Friday 01/16/2026.
To summarize, JBHT’s report highlighted weakness in the intermodal segment, which involves moving freight using multiple modes of transport, typically truck and rail, and accounts for ~50% of revenue and 55% of profits. Intermodal volumes declined 2% Y/Y, driven by the absence of front-loading activity seen last year. By contrast, the truckload segment, which represents ~6% of total revenue, saw volumes increase 15% Y/Y and revenue rise 10% Y/Y, while operating income declined 2% Y/Y. Management highlighted ongoing supply-side tightness and described the market as having “limited elasticity,” meaning that even small increases in demand could drive outsized rate increases given the lack of spare capacity following the multi-year purge of small carriers.
While these dynamics are generally understood by the market, management’s demand outlook was viewed as cautious, contributing to the selloff in logistics stocks. Management used the word “fragile” multiple times. While they noted that “no one canceled Christmas,” there was no peak-on-peak momentum heading into January. Retailers remain in a wait-and-see mode, keeping inventories lean and moving only what is necessary rather than positioning for a broad 2026 rebound.
Further uncertainty followed with the release of the December 2025 Cass Freight Index. Shipments declined 7.2% M/M and 7.5% Y/Y, with volumes down 13.5% over the last 2 years. Cass noted that shipment levels have effectively retraced to 2009 levels, during the GFC. The report reinforced the supply-side contraction but warned that some tightening could ease during warmer weather in January. Note that unlike the LMI, the Cass Freight Index is a lagging indicator.

Uncertainty has been amplified over the weekend. As noted above, the “Greenland tariff” news will likely lead to downside in logistics stocks come Tuesday (01/20/2026).
The P14 view
All in all, the P14 view is that the logistics industry is set up for a solid 2026. The U.S. economy is set up to run hot, the consumer is stimulated in 1H26, and manufacturing and homebuilding are staging a recovery, all of which have second-order effects for logistics. While the supply-side dynamics tied to constrained capacity are beginning to be priced in, current valuations underestimate the combination of recovering demand with ongoing capacity tightness
Inventories have to be replenished at some point, and my take is that with real wages rising and refunds arriving in 1H26, we could start to see volumes picking up soon. A dovish Fed and the repricing of rate cuts should bode well for the housing market, which has yet to see momentum pick up, unlike manufacturing, which has already started to show signs of expansion (on a state level).
In my view, a sustained dip in logistics stocks, in reaction to recent Greenland tariff news and lagging indicators such as the Cass data, as well as a conservative JBHT guide that lacked detail, should be BOUGHT.
Furthermore, this new tariff news is likely to bring with it some front-loading of goods affected by the tariffs. So, if you subscribe to the P14 view that these tariffs are likely a temporary negotiation tool, then dips in logistics stocks affected by these tariffs should be aggressively BOUGHT.
What to look for
Now for what you are here for. The P14 top picks sit under the paywall. For free subscribers, the top logistics name outside that list is GXO Logistics.
GXO is my largest position at a 20% weight across shares and calls. You can find my recent thesis update below. From a near-term perspective, the Q4 guide appears sandbagged at the midpoint, as incremental secured revenue at stable retention already supports high-end organic growth, and that is with flat/slightly declining volumes. GXO is a diversified 3PL warehousing play on the logistics recovery. The business generates most of its revenue in Europe, benefiting from China friend-shoring, Wincanton synergies as an idiosyncratic driver of returns, and an improving regional macro backdrop, including better-than-expected UK GDP data in November. In the U.S., the company has appointed an American CEO and is reshaping its leadership team to focus more heavily on North America. While the U.S. currently represents ~25% of revenue, it is expected to be a larger growth focus going forward, particularly in niche areas such as data centers, aerospace, and industrials. The business is well positioned to deal with continued tariffs, if any, while being a warehousing play that benefits from a no/low-tariff world. Robotics and automation are a tangible focus, and the business is widely regarded as the most tech-forward warehousing operator. In volatile volume environments such as what we are likely to face in 2026, being technology-enabled is a meaningful advantage, both for customer acquisition and GXO’s own margins.

This brings me to the top 5 P14 logistics picks under the paywall, which include second-order beneficiaries and names with idiosyncratic factors that add torque to their broader thematic upside. With an avg market cap of $767M, these stocks are under-the-radar beneficiaries that are yearning for attention…
Keep reading with a 7-day free trial
Subscribe to P14 Capital to keep reading this post and get 7 days of free access to the full post archives.