
P14 Weekly Screen #2- Cu higher, COPPER!
A deeper look at red gold, why P14 is long, and 5 names on the watchlist

Welcome to the second edition of P14’s weekly screen. Last week there was no screen because of the long PMTS pitch; if you haven’t checked it out, see below. It’s a decent business trading for cheap with ample upside (2x base case, 20% bear case). I’ll stick to this format going forward: when I post a pitch, no screen that week, so screens will be at least biweekly, with a goal of at least two per month to focus on quality over quantity.

I’d like to start by saying metals are not my expertise by any means. When I was an analyst I covered many industries, but commodities, including metals, were not among them. Now, however, times have changed as the world moves toward resource nationalism and rising physical capex intensity. It’s worth taking a look at, in the P14 view, one of the most underappreciated metals—copper—through the eyes of a generalist.
A brief overview of Red Gold
Copper has a history of over 11,000 years. As a native metal that occurs naturally in directly usable, unalloyed metallic form, it saw very early human use, first in ornaments and jewelry in 8000 BC. Over centuries, copper’s usefulness expanded rapidly and is now foundational to modern civilization: buildings, cars, electronics, and industrial applications, especially in the new world of AI.
In the U.S., ~42% of copper use goes to building construction, 23% to electrical and electronics, 18% to transportation, 10% to consumer and general use, and 7% to industrial machinery. But the U.S. is not the largest consumer of refined copper; it consumed just ~7% of global demand in 2024 (~1.6 Mt). China is by far the largest at 58–60% of global refined demand (15.5–16 Mt in 2024). To understand how countries fit in, let’s briefly look at the copper ecosystem.
The copper ecosystem can be split into 6 verticals. Let’s look at what they do, the biggest countries involved, and how they make money:
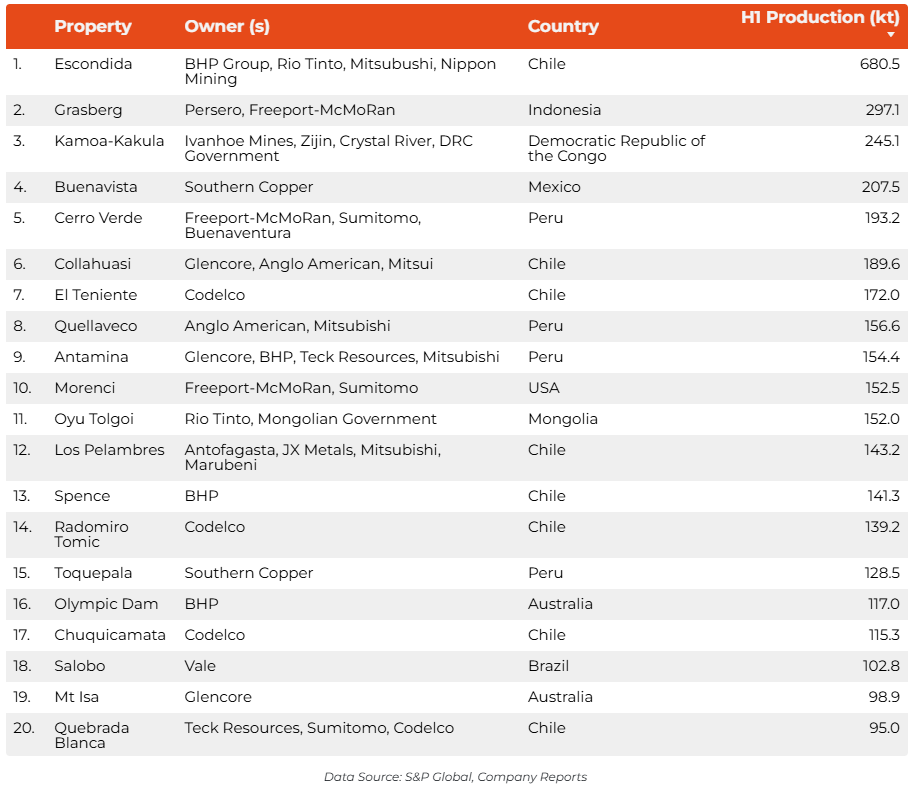
Exploration and development: Find and de-risk deposits via mapping, drilling, and feasibility. Make money by selling projects, raising equity, doing JVs, and selling royalties or metal streams. Biggest player: Chile, within LatAm copper exploration budgets of ~$3.2B in 2024.
Mining and concentration: Extract ore and process it into copper concentrate. Make money selling contained copper and by-products. Biggest producer: Chile, ~5.3 Mt in 2024 (~23% of global mine output).
Smelting and refining: Convert concentrate into high-purity cathode. Make money from treatment and refining charges and by-product sales such as sulfuric acid and precious metals. Dominant refiner: China, importing ~60% of global copper ore and producing more than 45% of refined copper (~13.6 Mt in 2024).
Fabrication of semi-finished products (rod, wire, tube, sheet): Turn cathode into conductors and shapes for power, construction, transportation, and electronics. Make money on conversion premiums and value-added processing. Largest fabricator: China, with about 50% of global fabrication capacity and roughly 11 Mt of additional copper and alloy capacity added since 2019, most of it wire rod.
Recycling and secondary refining: Collect and process scrap into refined copper or semis. Make money buying scrap at a discount to the copper price and selling refined or semis. Largest player: China, with major hubs in the EU and North America. Secondary refined totaled ~4.6 Mt in 2024 (~17% of global refined supply).
Royalties and streaming: Finance mines for a percentage of revenue or a fixed-price share of production. Make money by collecting those payments with low operating costs. Industry center: Canada, where the TSX and TSX-V host about 40% of the world’s public mining companies, about 32% of global mining equity capital, and about 47% of mining financings over the last five years.
To streamline the types of copper being produced, think in terms of higher-quality versus lower-quality. Higher-quality copper is easy ore and clean material that is richer in copper and low in impurities, usually near-surface oxides that you can process simply and cheaply into 99.9% cathode. Miners like it because you move less rock, use fewer steps, and keep costs low. Lower-quality copper is harder ore that is lower grade or dirty with impurities, often deeper sulfides that need more blasting, more chemicals, and full smelting and refining to get the same metal, so costs are higher and margins thinner. At the ore stage, higher-quality material can go from rock to 99.9% cathode at or near the mine via Solvent Extraction/Electrowinning., while lower-quality material is concentrated and shipped to large smelters. Once both are refined to cathode, the end metal is identical and goes everywhere: power cables, building wire, electronics, and autos.
As a commodity, copper primarily trades on futures contracts on global exchanges. In the West, the most relevant futures are COMEX copper (HG) in the U.S. and LME 3-month copper in London. In APAC there is the SHFE. If you cannot trade futures directly, there are ETFs that track copper price exposure: CPER in the U.S. tracks an index that holds a portfolio of 3 to 9 month copper futures, and COPA in the U.K. offers similar exposure. These are proxies to go long or short copper.
Apart from going long the commodity price, there are ETFs that track miners. In copper mining ETFs, the most popular are: United States, Global X Copper Miners COPX; Canada, Global X Copper Producers COPP on the TSX; U.K. and Europe, iShares Copper Miners UCITS MINE on the LSE; APAC, Global X Copper Miners WIRE on the ASX. That covers the instruments and the brief overview. Now to what matters most: the future of copper prices and the driving forces.
The consensus view
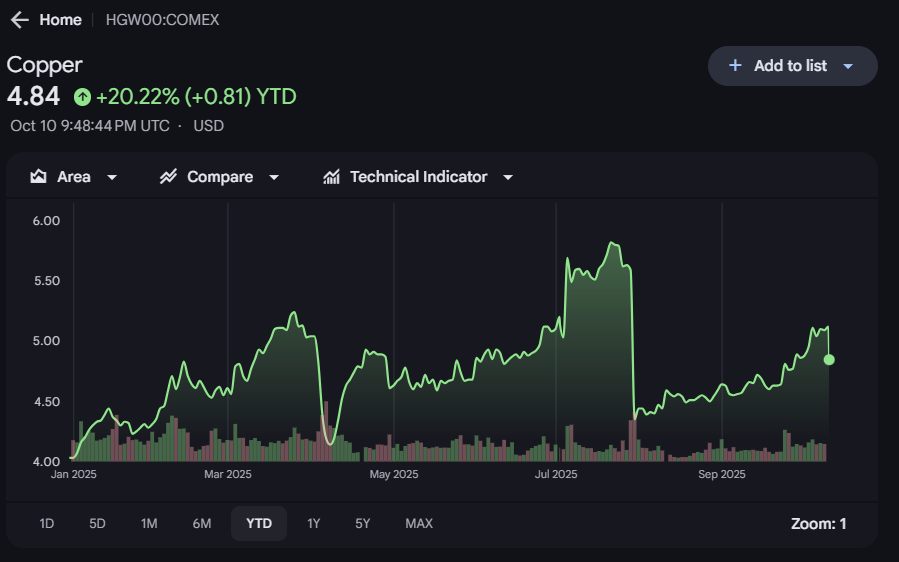
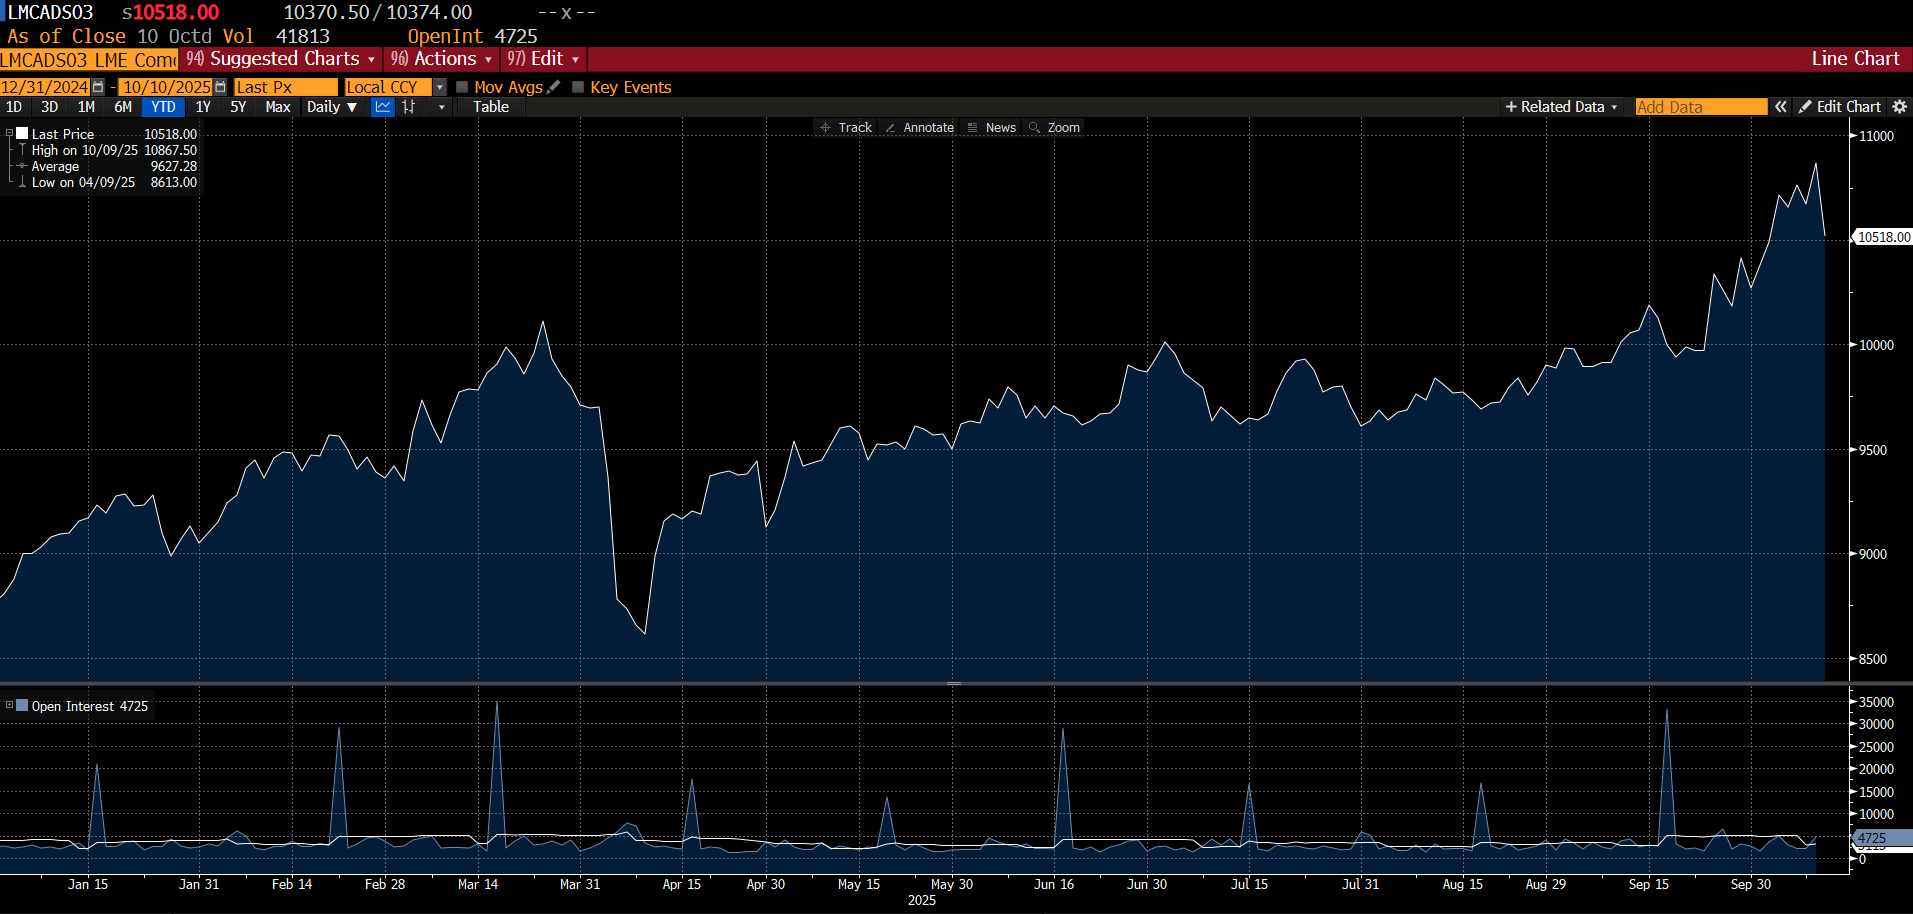
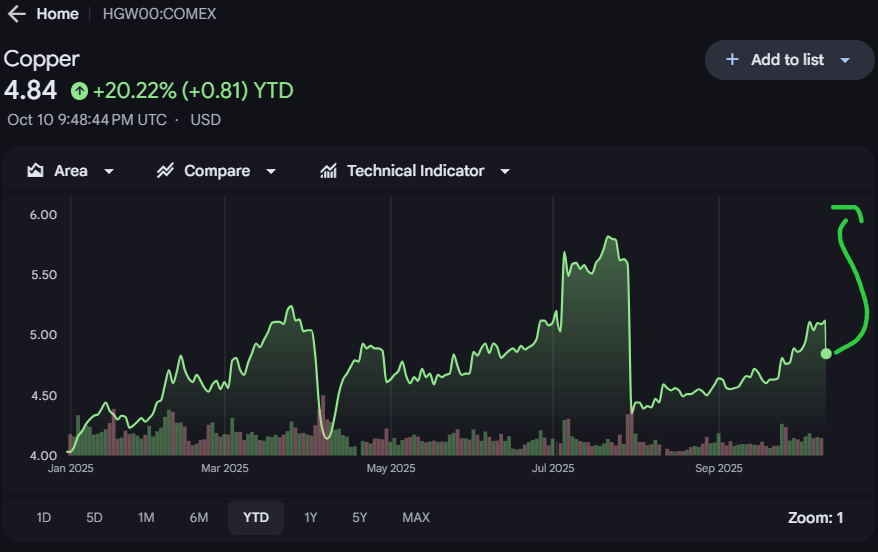
The graphs above show the HG continuous contract and LME 3-month futures. The early-April downside was due to Liberation Day, but what explains the ~20% drop on HG futures in late July? In early July, the White House floated a 50% tariff on “copper imports,” which traders took to include refined copper (cathode). On July 30, the proclamation clarified the 50% duty would apply to semi-finished copper products and copper-intensive goods (wire, tube, sheet, connectors, etc.), not refined cathode. Markets had bid up U.S. futures on the idea that refined imports would be taxed heavily, tightening U.S. supply; when refined was excluded, that bullish premise evaporated and U.S. futures snapped lower. A similar move was not observed in LME 3-month futures.
What drove the downside on Friday (10/10/25)? China announced export-curb controls for rare earths starting November 2025, and the U.S. responded with an additional 100% tariff on Chinese goods and export curbs on critical software. Refined copper, which is central to our thesis, is excluded. The additional 100% appears to apply to goods already in the 30% bracket, not new categories. In any case, the U.S. imports minimal refined copper from China (~1.25%). So the Friday blip in copper was not a direct copper action, but a macro risk-off move as copper is sensitive to trade and global-growth concerns. If refined copper were ever tariffed, prices would likely rise (as seen in July before the clarification), not fall.
Aside from Friday’s blip, the market’s consensus view is that copper prices will rise. COMEX futures have begun to recover from the late July drawdown and LME has continued higher.
As a value investor, I fight the urge to be contrarian for its own sake. Sometimes it pays to align with consensus. You may have heard the copper long trade is overcrowded; I think it is nowhere near crowded enough. I say this as a generalist, but the dire supply setup and rising demand argue for a fundamental reset in copper prices. It is a commodity, so volatility happens, as seen Friday, but given today’s landscape, copper prices are set to rise over the coming years.
We can dissect this by looking at both the supply side and the demand side.
Supply-side dynamics
Most copper comes from primary mining, where ore is extracted from large open-pit or underground deposits and processed into concentrate and then refined metal. Recycling of scrap is an important secondary source (roughly 30% of refined copper comes from scrap), but scrap supply depends on the availability of old products, so growth in demand must largely be met by new supply. World mine production reached 23 Mt in 2024, up 1.7% from 2023.

The USGS estimates 2024 reserves at ~980 Mt and undiscovered resources at ~3.5 Bt. That sounds abundant, but converting undiscovered resources to production is neither quick nor easy. The average time from discovery to production is ~16 years. About ~12 years are spent on discovery, exploration, studies, and permitting. Permitting is slow because of government process and environmental review. While mineral nationalism is pushing for speed, it may be too late to change near-term supply.
The good versus bad copper picture is also unfavorable. Ore grades have been declining. In the early decades, many producers exploited high-grade oxide caps (>1%). Average copper content in mined ore has fallen from ~1.2% in 2000 to ~0.6% in 2025, which requires processing 2x the material for the same copper output. Major producers like Escondida have seen grade declines of 8–12% over the past 5 years. Removing more waste and processing ore with impurities increases opex significantly. Copper miners including Anglo American, Glencore, Teck Resources, and Ivanhoe Mines are also struggling to raise output because of poor grades, inadequate water, and seismic activity.
Costs to build mines have surged. The IEA estimates that capital needed to bring on new supply in Latin America has risen ~65% since 2020. That is true even for brownfield projects that add to existing operations. In the early 2000s, new copper projects typically cost $4,000–5,000 per tonne of annual capacity; by 2012 the figure rose to ~$10,000/t, and by the early 2020s some projects required $15,000–45,000/t. Drivers include declining grades, more remote and deeper ore bodies, stricter environmental requirements, and inflation in labor and energy. At current prices most new mines are uneconomic with most developers saying that prices need to be at least ~$12,000/t to justify investment. With mine development taking more than a decade, companies are reluctant to commit billions without clear long-term price signals and stable permitting. Many producers prefer M&A and brownfield expansions over greenfield builds.
Copper mines are inherently unsafe because they combine unpredictable geology with extreme operating conditions: rock masses under high stress can fail without warning, block caves and deep stopes amplify seismicity, fractured ground leads to sudden water and mud rushes, and heat and low oxygen strain people.
If that sounds dire, 2025 made it worse. Codelco cut its 2025 guidance after El Teniente tunnel collapse (now 1.34–1.37 Mt vs 1.37–1.40 Mt). Production losses from the accident are estimated at ~48 kt this year, up from a prior ~33 kt, and management has said that while El Teniente has resumed after the July 31 collapse, production will likely remain around three-quarters of prior levels well into 2026. Freeport Indonesia’s Grasberg suffered a deadly slide that crippled Q4 output and forced a ~35% cut to next-year sales guidance. The May 2025 flooding at Kamoa-Kakula led Ivanhoe to cut 2025 production guidance to 370–420 kt (from 520–580 kt). The share of global copper production hit by unplanned disruptions rose from under 5% in 2014 to 5.7% in 2024, and is expected to surpass 6% in 2025. Taken together, the ICSG cut 2025 mine-growth expectations to ~1.4% (from 2.3% prior) and flipped its 2026 view to 2.3% growth but with a ~150 kt refined deficit on recent mine disruptions in Indonesia, Chile, and Congo.
Demand-side dynamics
Global consumption reached about 27 million tonnes in 2024, up ~3% from 2023, and consensus points to ~33 million tonnes by 2035. The most powerful thematic drivers are grid upgrades, electric vehicles, and now data centers. On EVs, U.S. noise around tax credits matters less than China’s market leadership and the likely rise of autonomous vehicles (waymo) in the U.S. itself. EVs use 3–5x more copper than a typical internal-combustion car, with electric buses at ~11–16x, so transport copper use is climbing quickly. Copper demand from EVs and charging networks is projected at ~1.2 Mt in 2025 (nearly 6x 2020 levels) and ~2.2 Mt by 2030 as adoption accelerates.
Electrification through grid expansion and renewable energy is at the core of demand. China’s rapid grid expansion has been the single largest contributor to global demand growth over the past two years. The U.S. is finally moving too: Bernstein calls the grid problem extremely serious, with power prices likely rising from $0.10/kWh to above $0.15/kWh as after a flat decade, electricity use is projected to grow ~2% annually for the next 5–6 years. Upgrading an old grid takes a lot of copper. BMI projects copper demand for power generation and transmission rising from ~12.5 Mt in 2025 to ~14.9 Mt by 2030, which means nearly half of all copper tied to electrical networks.

Add the global shift to renewables: Wind energy needs ~2.5–6.4 t/MW of copper and solar ~2.8–4.8 t/MW, versus ~1–2 t/MW for coal or gas plants. Much of this spend is less sensitive to short-term economic dips because governments and companies treat renewables and grid resilience as long-term priorities.
The data center boom adds a new structural layer. A typical facility averages ~27–33 t/MW of copper, and hyperscale builds can run to 10,000s of tonnes once you include distribution and liquid cooling. Global data center copper use has climbed from ~78 kt in 2020 to ~260 kt in 2025 and is tracking toward ~650+ kt by 2030; BloombergNEF expects AI-oriented facilities to average ~400 kt per year over the next decade, peaking near ~572 kt in 2028. Note that the 10 GW Stargate build alone implies ~270 kt. Reshoring in the U.S. adds support as well: a 200 MW fab can use ~5–6 kt of copper on site, and new auto plants and other manufacturing reinforce the trend. With resource nationalism accelerating, copper has been proposed for the 2025 critical minerals list, which could bring more government involvement in domestic projects
No demand discussion is complete without China. State Grid plans ~¥650B (~$88.7B) in 2025 for transmission, distribution, and smart-grid upgrades; smelters produced a record 13.64 Mt in 2024 and guide higher for 2025 despite tight ore, supported by more scrap and by-product credits. Chinese miners invested a record $5.3B in 2024 and ~$2.5B in the first eight months of 2025 in overseas copper assets in Peru, the DRC, and Zambia, deals expected to deliver ~24% of global supply growth over the next decade (~1.53 Mt of ~6.5 Mt). Trackers show refined consumption up ~3.3% in 2025, record concentrate imports, and firm import premiums into late 2024 and early 2025; even 1–2% growth on ~60% global share adds large tonnage each year and keeps pressure on prices.
The P14 view
The market is slowly realizing that the late-July tariff clarification sparked an overreaction in COMEX December futures. Prices have begun to creep back, helped by late-September supply disruptions, while China and global demand remain resilient. In my view, the Friday dip should be bought on further weakness. First, if equities keep sliding, I expect the 100% tariff headline to get watered down or resolved in the coming months, and any tariff on refined copper (China not relevant here) would be bullish for price anyway. Second, nothing has changed on demand, especially with China steady. Third, this is not an export ban but a tighter export-license regime on rare earths. That creates bottlenecks until licenses are approved, and it could even be copper-positive if China accelerates domestic chipmaking and related power buildouts that use more copper.
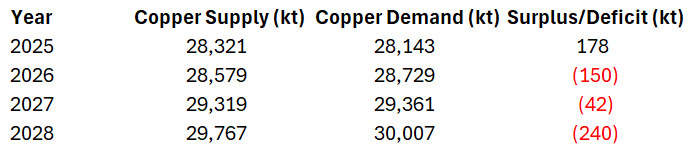
A structural deficit is lining up. Newly committed projects through 2030 add only ~4.4 Mt of annual capacity, well short of projected needs. The street is moving in the same direction. Forecasts are revising to earlier and larger deficits as demand goes up and supply is cut. Goldman flipped its 2025 outlook from a surplus to a slight deficit, and several firms now point to the largest shortfall in decades in 2026–2027. Freeport’s force majeure alone points to ~900 kt missing in 2026. Teck just cut guidance again: 2025 copper now 415–465 kt (from 470–525 kt), 2026 455–530 kt (from 550–620 kt), and 2028 435–510 kt (from 475–545 kt). ICSG and Fastmarkets call for deficits starting in 2026 and worsening by 2028; ICSG also notes the projected 178 kt surplus in 2025 could flip to a deficit.
The consensus largely remains bullish, though recent swings in prices quickly lead the sell side to update targets, classic. Goldman, despite projecting deficits starting in 2025, expects prices to remain only $10,000–$11,000/mt in 2026 and 2027. Note that Goldman told clients to go long copper a day before the late-July plunge; call this conservatism PTSD if you like.
I expect HG1 (active front-month copper futures) to retrace to the July highs of $5.80/lb and hit $6/lb in 2026, and $7/lb by 2027–2028. $6/lb ~ $13,228/mt and $7/lb ~ $15,432/mt. On what numerical grounds? The simple answer is I do not know; I am a generalist. A commodity is not a stock where I can slap on a multiple, and I cannot project cash flows for a DCF. What I can say is both supply and demand point to a fundamental reset in prices.
So far I have played this with call options on the CPER ETF, which tracks the forward December, March, and May contracts. At the time of writing, P14 has a 7% position in $30 and $35 calls for Jan ’26, with an unrealized ~+98% P&L.
It is too late for supply improvements to offset the current pressures. The only real bear case for price here is a slowdown in China, which does not seem likely at present. Data center copper usage estimates can be overstated, but I think that is more than offset by grid upgrades tied to rising electricity use, which is still understated.
Now that the broad thesis is laid out, let’s get to what matters. 5 names on the P14 watchlist that I am building on the dip in copper. I’d like to thank my friend Hejran Darya, a P14 subscriber and soon-to-be Substack writer (subscribe!), for input on the watchlist below.
Happy reading and don’t let the volatility get to you!
