
P14 Weekly Screen #9 - Chemicals
Long Chemicals + 5 stocks with mini-theses

Ever heard the phrase “so goes January, so goes the year”? If that holds, then with double-digit YTD returns across many chemicals stocks, surely the sector deserves a deeper look.
I am admittedly late, as many names are already up >30% since late last year. That said, there is still room to run, with a select group of stocks offering added torque.
Much like my logistics screen, where my targeted list of 5 SMID-caps has already generated an average 11.8% return since the pitch date on 01/18/2026.

The drivers of chemicals stock returns are similar in some respects. At its core, it all comes back to a recovering industrial economy. But chemicals always have more layers. I will walk through the broad thematic setup first before diving into the names positioned for further upside under the paywall.
Cyclicals and market mechanisms
Let’s get the basics out of the way. If there were a textbook definition of cyclicals, chemical companies would fit it perfectly. A key reason the sector has rallied since the new year is this cyclical nature and how it responds to shifts in market flows.
In reflationary environments, cyclicals tend to outperform. Chemical companies are largely price takers, so when indicators like PPI and ISM bottom, that is typically when cyclical industries like chemicals begin to wake up.
Valuation floors
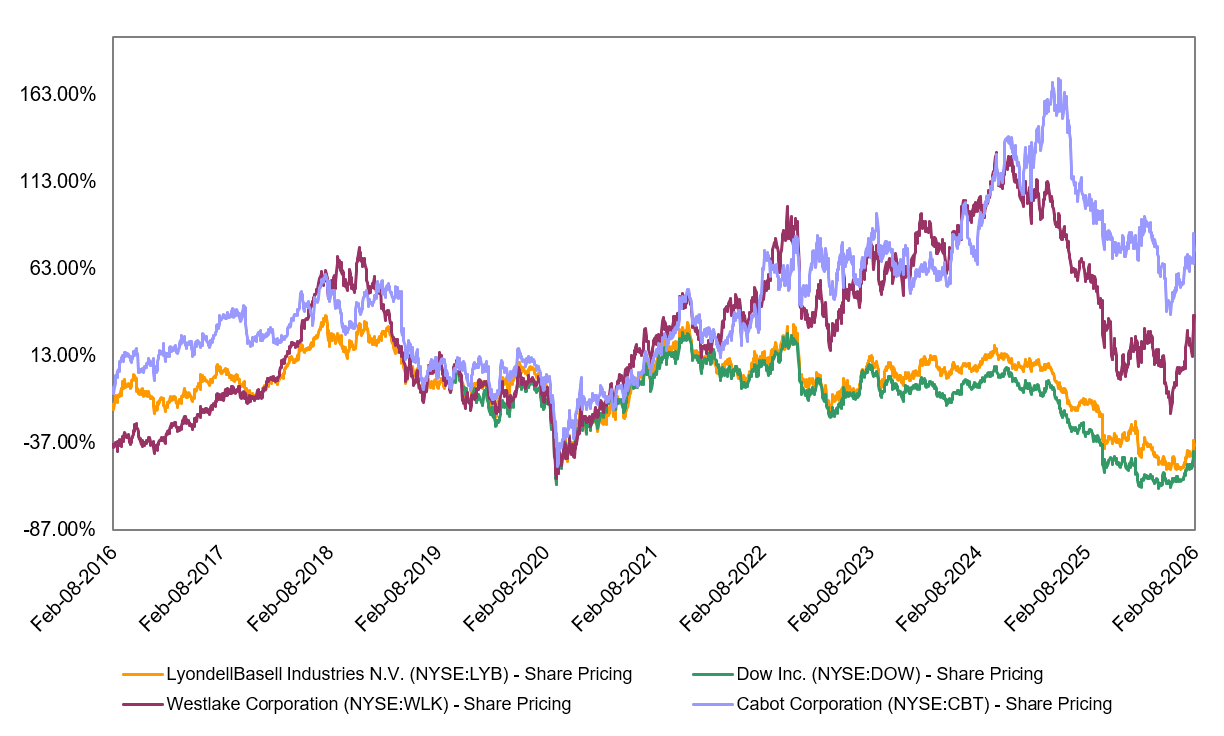
The current awakening has followed a deep and prolonged downturn. Several major chemical companies such as DOW saw their multiples and share prices crushed, with a -41.7% return in 2025. For the industry, 2025 was largely a lost year, with ample supply and historically weak demand compounded by tariff uncertainty.
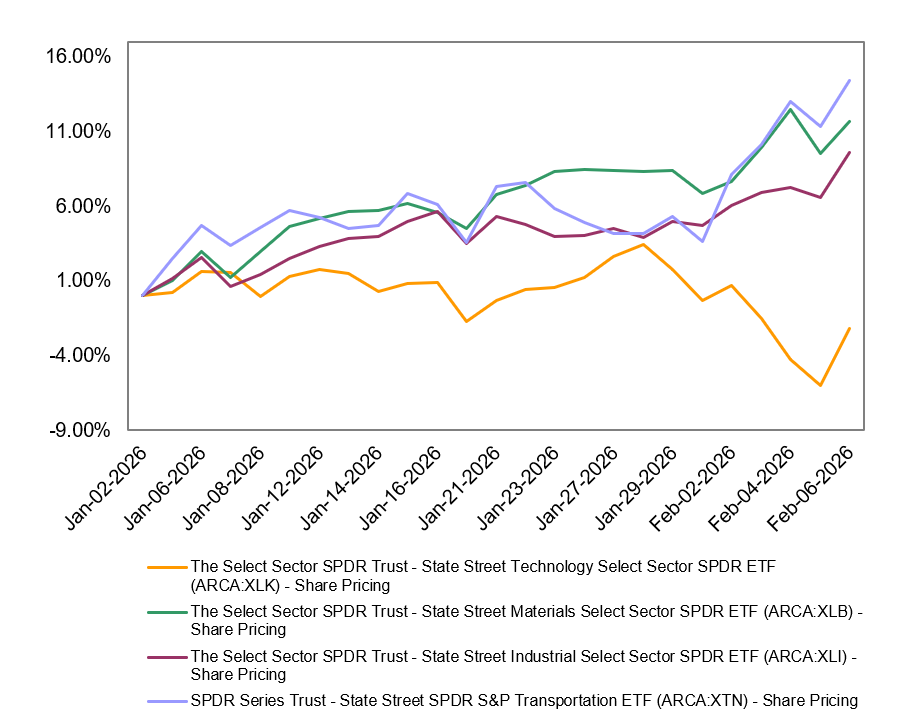
During sector-specific drawdowns like the one we recently saw in tech, capital often rotates toward deep value areas offering cyclical recovery. Chemicals have emerged as one of those beneficiaries.
Demand drivers
Demand drivers for the chemicals industry are set to return in spectacular fashion. The major demand drivers are the “big two”:
Manufacturing
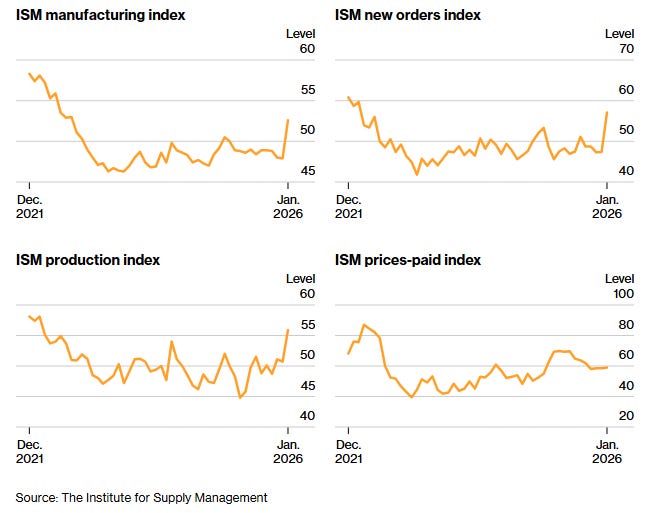
You have likely seen the headlines. The ISM manufacturing index just posted its strongest reading since August 2022. ISM manufacturing rose to 52.6 from 47.9, backlogs increased for the first time since 2022, exports improved, and inventories declined sharply, signaling sustained demand.
A major contributor here is tariff stability. Much of last year’s weak PMI data stemmed from uncertainty around tariffs. With the year turning over and midterms approaching, markets have largely begun to look through tariff noise. Supply chain managers now have greater visibility than they did in 2025.
Inventories were depleted by the end of the year, so it may be the case that the ISM manufacturing index is “inflated” to start the year. Even so, the outlook for 2026 and 2027 looks materially better than 2025, with reshoring effects increasingly showing up in manufacturing demand.
Rate cuts are also on the horizon, with weak employment data to start the year and inflation appearing relatively stable despite recent hot PPI data . In my view, pricing the incoming Fed chair Kevin Warsh as an outright hawk based solely on historical commentary is a silly assumption. Policy will be dynamic, and political pressure is only rising.
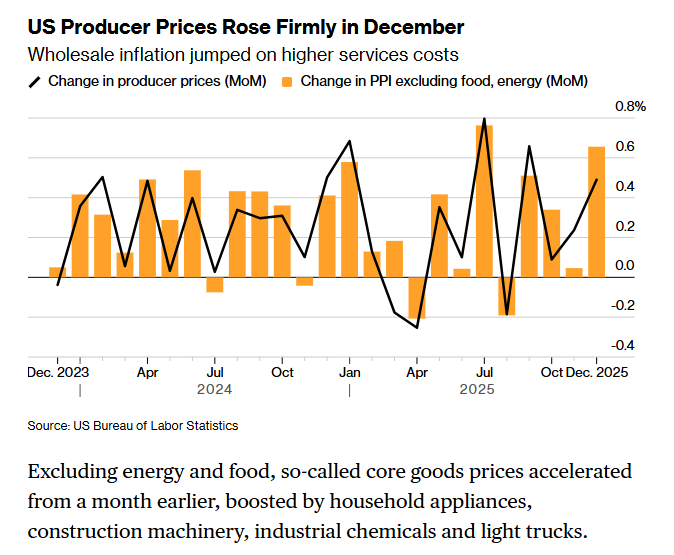
Hot PPIs are generally good for Chemicals, given that they are the de facto raw material in manufacturing and are price takers.
Housing & Construction
Housing is the largest end-market for chemicals (PVC, paints, insulation, adhesives). Forecasts from Fannie Mae and the ACC point to housing starts being relatively flat in 2026 at roughly 1.3M–1.36M units.
Mortgage rates are the key bottleneck for buyers. These are driven by the long end of the curve, which reflects Fed policy as well as expectations for inflation and growth. That said, mortgage rates are also influenced by supply and demand dynamics. The administration has become increasingly supportive of homebuying as a midterm election strategy. Recently, GSEs Fannie Mae and Freddie Mac have been authorized to purchase $200B of MBS. While this represents a fraction of the $9T+ US MBS market, it is a small step in the right direction to stimulate mortgage demand. There are other ways the mortgage market can be stimulated. On this topic, I recommend listening to this brilliant podcast featuring Joseph Wang on Monetary Matters:

Additional speculative upside comes from affordability-focused homebuilding initiatives. Recent reports indicated that builders have floated proposals to construct up to 1M homes, representing >$250B in housing investment.

Other demand drivers
Electrification is another key tailwind. Data center capex is expected to surge again in 2026, with chemical usage benefiting both during construction and in cooling and operations.
Less discussed is the acceleration in vehicle electrification and the resulting demand for batteries. Global EV battery demand is forecast to grow 31.7% Y/Y in 2026 to 1,187 GWh, up from 901 GWh in 2025.
Consumer staples packaging provides an additional defensive demand driver, typically offering a floor even during economic slowdowns.
The weakest end market is agriculture. Elevated fertilizer prices have pressured volumes as farmers tighten budgets amid tariffs and inflation. Rabobank expects 2026 to be another year of subdued consumption, though stabilizing natural gas prices and the ramp of green ammonia projects could support a volume recovery into the 2027 planting season.
Supply side dynamics
This is where stock selection matters most and where you want to distinguish between the good co’s and the bad co’s. A simple and key distinction you can make is specialty versus commodity chemicals.
As with most physical industries, China is always in the picture. Over the past two decades, Europe’s share of global chemical production has dwindled to 13%, while China’s has risen to ~45%. China’s push for self-sufficiency has driven massive capacity expansion. Between 2020 and 2025, global ethylene capacity increased by 40M tons, with ~70% built in China. The result is China exporting excess commodity chemicals such as polypropylene into Southeast Asia, Africa, and Latin America, depressing global prices. While there is speculation that EU plant closures could tighten supply, in my view, this is unlikely to offset the scale of Chinese overcapacity.
We are hearing reports of the Chinese government finally becoming aware of the wrath their investment cycle has bestowed upon the Europoors and the rest of the world. That being said, this has been discussed multiple times, and recently constructed capacity is just going live. So, even if you hold the CCP true to their word, any easing of oversupply will likely occur a few years down the line.

US chemical stocks are the most shielded from Chinese supply, given domestic consumption and production, with trade tariffs offering protection. Even so, as a generalist, I prefer to avoid incremental commodity exposure through chemicals and rather stick to metals.
From a P14 perspective, commodity chemicals are best avoided unless there are idiosyncratic factors that justify upside. These are generally low-margin businesses that exhibit 2x the cyclicality of their specialty peers.
The industry is perpetually restructuring, with ongoing plant shutdowns and consolidation. Japanese ethylene producers and Korean petrochemical firms are now coming under pressure, largely due to the Chinese supply glut. Oversupply is unlikely to abate without a sharp rebound in global demand. That said, with demand recovering at the margin, my view is that investors would likely still do well owning diversified players.
Due to ongoing consolidation and M&A, many players in the industry are heavily leveraged. This creates risk for dividends if investment cycles restart in response to improving demand.
This is why I prefer higher-margin specialty chemical businesses with durable demand and niche positioning. In my view, the true upside lies in smaller specialty players that also offer buyout optionality as consolidation accelerates.
A key supply-side cost driver is rising crude prices alongside lower natural gas prices. In industrial chemistry, the “magic formula” for North American profitability is a wide oil-to-gas price spread. Most NA facilities use ethane as a feedstock, which is derived from natural gas. When gas prices are low, raw material costs are low. In contrast, much of the rest of the world relies on naphtha, which is derived from crude oil. When oil is expensive and gas is cheap, NA producers manufacture the same products as global competitors at a lower cost. Natural gas prices recently experienced a historic speculative rally, but prices have since cooled materially.
The case for flows
2026 is shaping up to be a year for the physical goods economy. We are seeing first-hand that in risk-off environments like this past week, sell-offs in SaaS and services stocks as well as high-momentum, high-beta AI stocks are finding their way into physical industries such as logistics, chemicals, and industrials. This coincides with large-scale fiscal stimulus via OBBBA and improving ISM manufacturing data alongside tariff stability.
This may be the year where big capex spenders are ignored and the beneficiaries come into greater focus, with cash flows taking center stage. This setup especially favors companies that completed their investment cycles during the downturn and can now benefit from fixed-cost leverage as demand recovers.
Valuation context - how high can we go?
You may be wondering, given the double-digit returns many chemical stocks have already posted YTD, whether it is even worth digging through hundreds of companies. Is there really more upside left?
For one, you do not need to. I have already identified 5 chemical co’s that, in my view, are best positioned and still yearning for a rip.
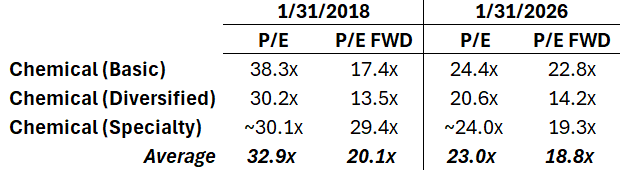
For two, yes, there is still plenty of upside. Similar to logistics, the last true bullish cycle for chemicals was post-COVID. However, multiples from that period are not the right reference point given the severity of the drawdown and the violence of the recovery. Beyond that distortion, the 2016–2018 period stands out as the last “normalized” bull market for chemicals.
The 2016-2018 cycle is widely viewed as the last healthy, pre-pandemic expansion, characterized by synchronized global growth. The US, Europe, and China all experienced expanding industrial production. NA producers benefited from the shale advantage, as new ethane crackers came online at a time when US feedstock costs were low and global chemical prices remained high, driving record margins. At the same time, strong demand for plastics and specialty chemicals tied to autos and construction outpaced supply additions, creating tight markets.
Given their cyclical nature, chemical stocks are typically valued on a forward basis. As a rule of thumb, cyclical stocks tend to price in a recovery 4–6 quarters ahead of the actual improvement. That is why we are seeing stocks move now. Specialty chemicals are slightly different in that their demand is more durable depending on end markets, but they are still cyclical.
Since 2022, we have effectively been in an industrial recession. With rate cuts on the horizon, deregulation, fiscal stimulus through OBBBA, and tariffs driving industrial reshoring whether one likes it or not, chemical stocks and other physical goods stocks are signaling that a recovery is coming. In my view, the recovery begins in 2H26 as rate cuts start to impact mortgage affordability and homebuying. The recovery will be stronger in 2027 as supply and end-markets demand stabilizes.
Back to multiples. During the 2016–2018 cycle, XLB peaked on 01/15/2018 at $31.64 before falling to $25.64 by year-end amid trade war 1.0.
At the peak, chemical stocks were trading at a meaningful premium on TTM P/E multiples relative to today. On a TTM basis, the potential expansion is ~9.9x. On a forward P/E basis, the implied expansion is lower at ~1.4x, largely because earnings revisions have not yet been priced in. We are still early in the cycle, and as the year progresses, earnings optimism should increase.
Within this, specialty chemicals stand out. The group currently trades at the steepest forward multiple discount versus 2018, at ~10.1x below prior cycle levels. On a TTM basis, multiples are ~6.1x lower.
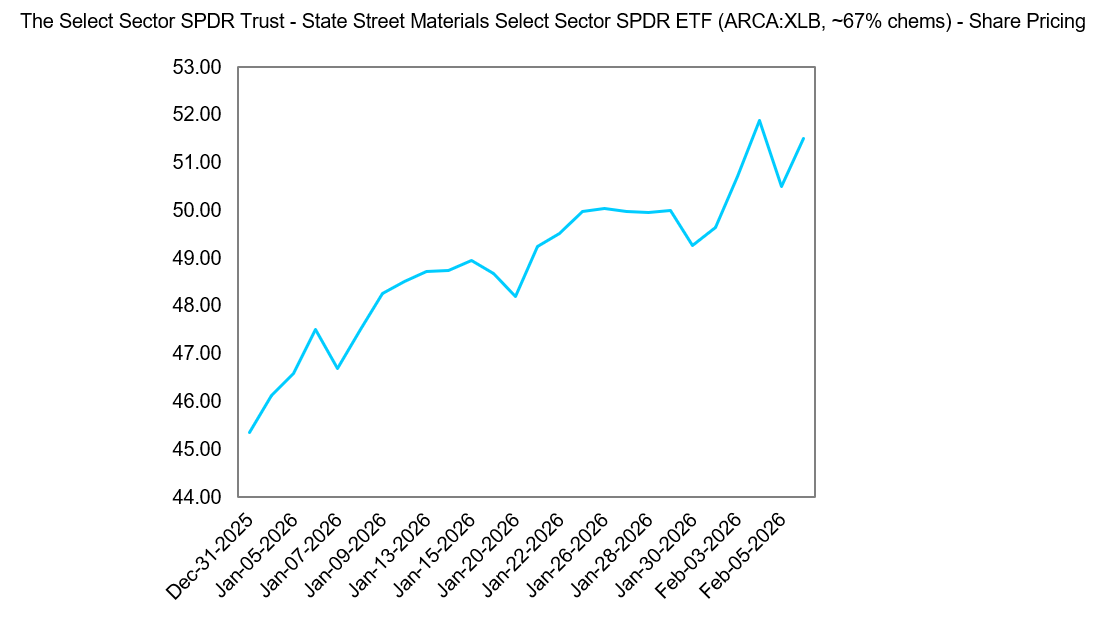
All of this suggests that if the industrial economy does return in earnest, there is still significant room to run. You can see this simply by looking at the share prices of the largest beaten-down chemical stocks.
Which brings us to why you are here. Below are P14’s top specialty (4) and commodity chemical (1) picks. As usual, these are SMID-caps (avg mkt cap: $6.3B). They offer solid fundamentals and idiosyncratic growth catalysts in the specific end markets they serve. The SMID-cap exposure is also accretive in a cutting cycle, as the group historically outperforms during rate-cut environments.
