
P14 Weekly Screen #12 - Gold
The Bull Case for Gold and a Few Stocks to Watch

Disclaimer: Nothing posted by P14 Capital should be considered financial advice. The author of this post may hold positions in the tickers discussed. Please consult a financial advisor and/or conduct your own due diligence before making investment decisions.
07/31/26-08/03/26
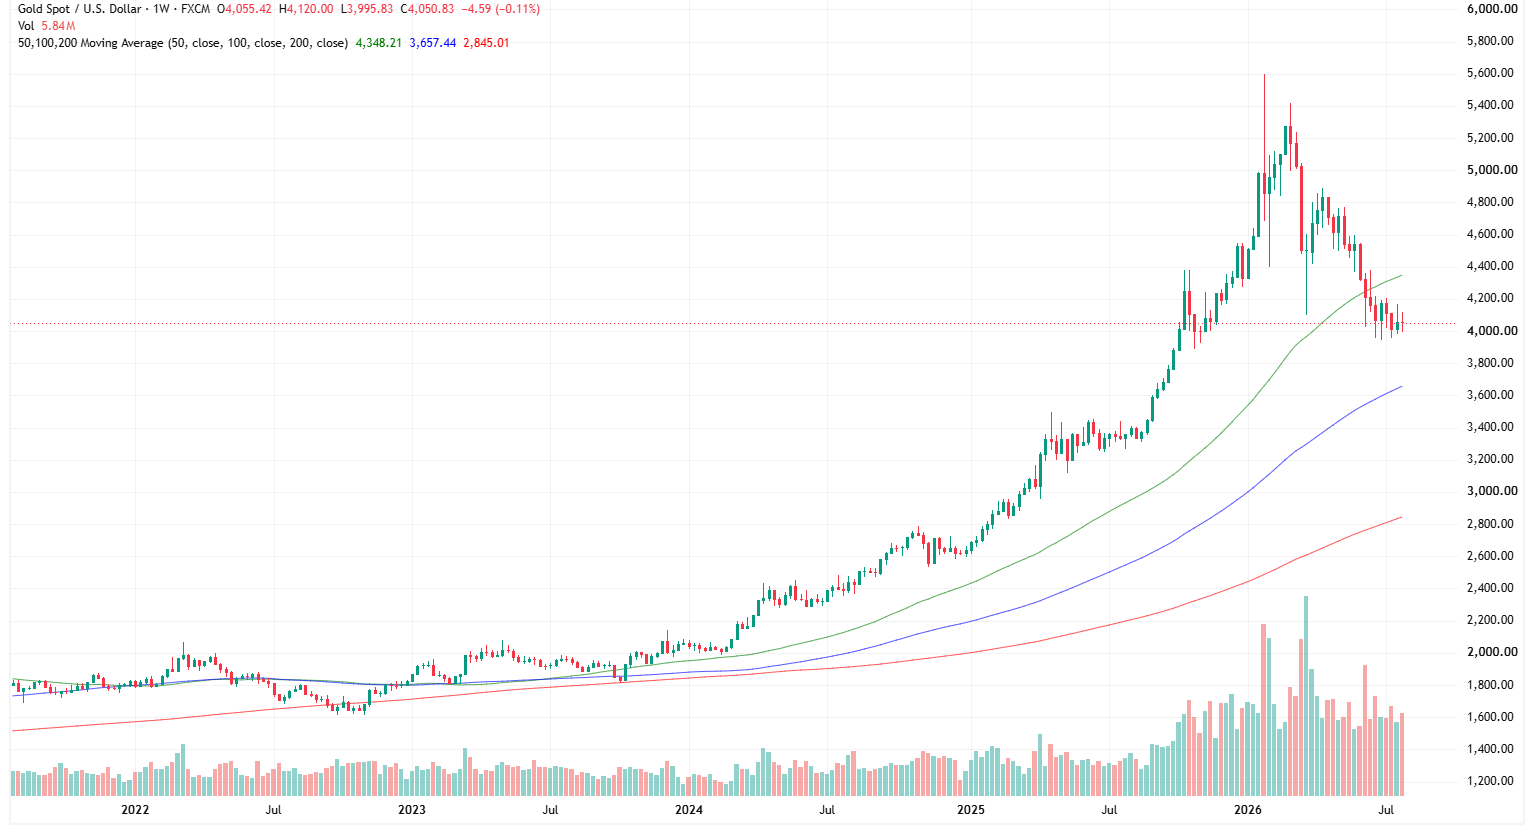
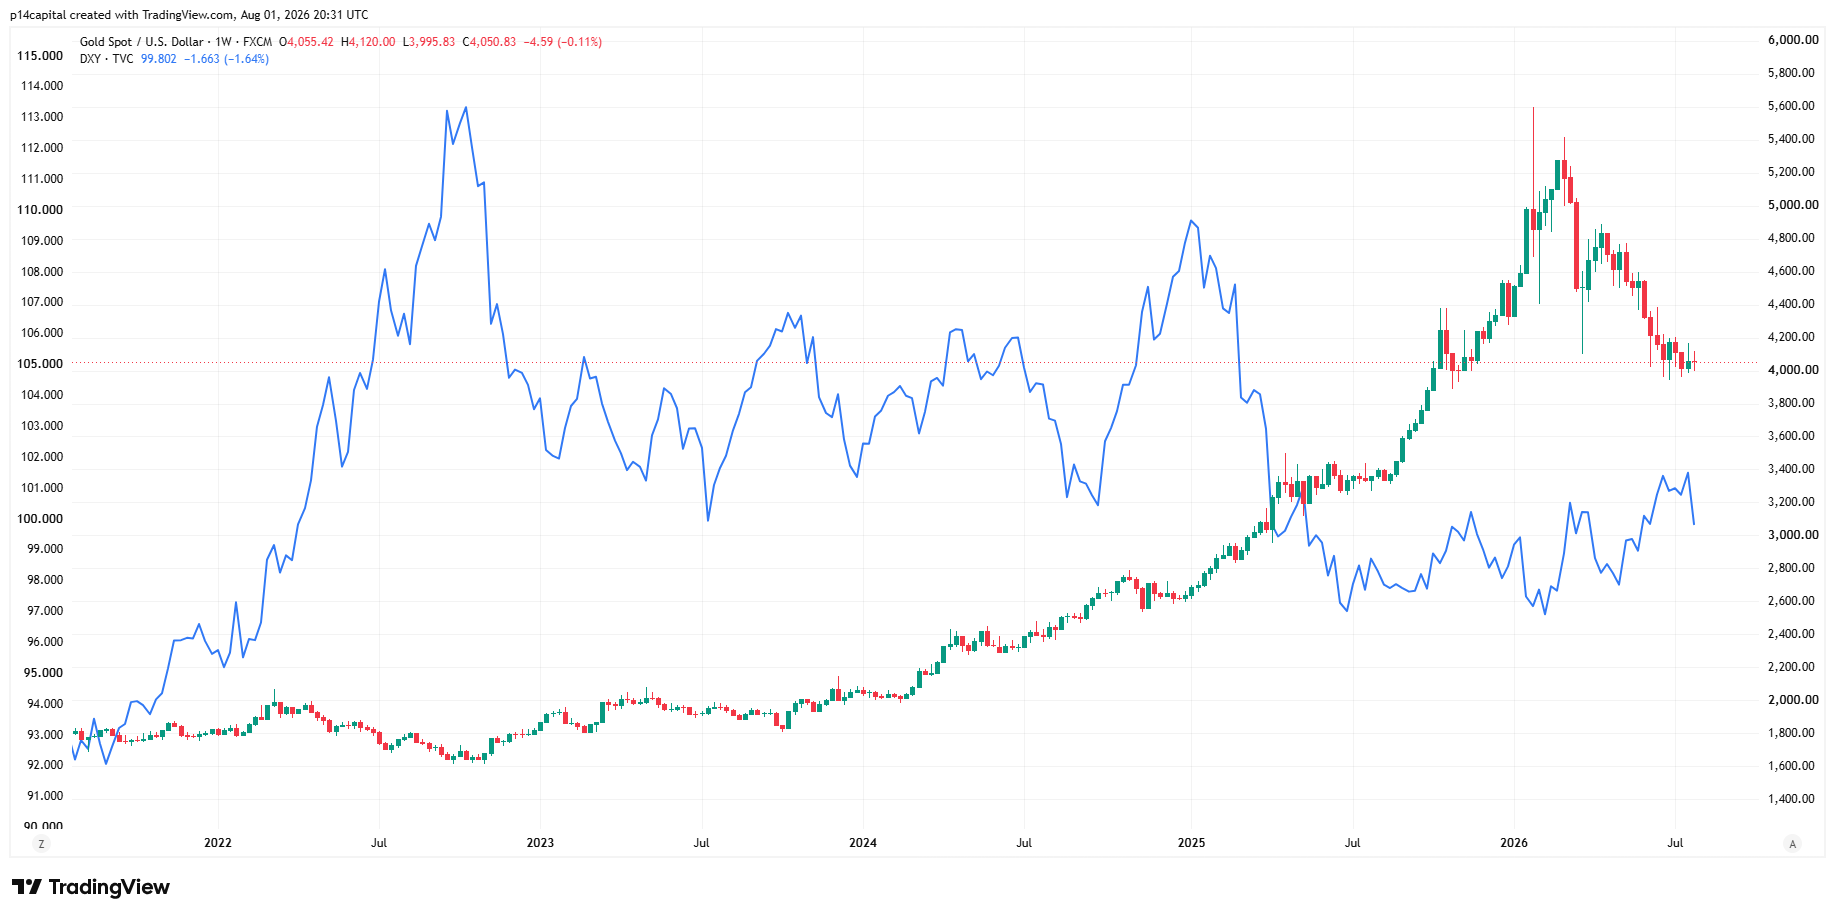
After a historic early-year rally to an intraday high of $5,595/oz in January, gold has struggled to catch a bid amid geopolitical, inflationary, and demand headwinds. What was once treated as a pure safe-haven asset has recently traded with heightened sensitivity to real yields and the U.S. dollar.
At a spot price of ~$4,000, I think gold presents an attractive long opportunity heading into the remainder of Q3 and Q4. I do not have a hard price target, but I think a rally back to flat YTD, or ~$4,300, is certainly plausible. To supplement my bullish thesis, I selected 3 gold stocks for my watchlist to capture positive beta and idiosyncratic catalysts that are difficult to ignore.
Before getting into why P14 is bullish on gold, let us dissect the basics.
Commodity Overview
Gold is one of humanity’s oldest monetary assets, serving as a store of value and medium of exchange for millennia. Following the end of the Bretton Woods system in 1971, it transitioned into a freely traded macro asset. Over the trailing five years, gold has returned ~123%, compared with ~71% for the S&P 500. This outperformance has continued over the past year, with gold returning ~20% versus 18% for the S&P 500.
Today (07/31), spot gold trades at $4,043/oz, down 6.4% YTD relative to the S&P 500’s 9.6% gain. Its underperformance has been driven by the unwind of a speculative, retail-driven rally fueled by leverage during the first 28 days of the year.
Market participants can access gold through physical bullion, physically backed ETFs such as GLD, IAU, and GLDM, CME/COMEX futures, and gold-mining equities or ETFs such as GDX. Combined OTC and exchange trading volumes average more than $240B per day, providing deep liquidity for institutional allocations.
What Drives Price
Gold prices are primarily driven by real interest rates, the U.S. dollar, inflation expectations, the trajectory of sovereign debt, and net purchases by central banks.
If the world were a simple place, then:
Interest Rates: Gold is a non-yielding asset, so lower real interest rates decrease the opportunity cost of holding it.
U.S. Dollar: Gold is priced in USD globally, so a weaker dollar makes it cheaper for foreign buyers.
Inflation: High inflation erodes the value of fiat currencies, leading participants to buy gold to preserve purchasing power.
Sovereign Debt: A high and rising national debt burden can force governments to monetize debt, elevating credit risk and concerns over currency debasement. Gold benefits as a reserve asset with no counterparty risk.
Central Banks: Geopolitical risks and a confluence of the factors above lead foreign central banks to hold gold as a reserve asset, currency hedge, and source of monetary backing.
However, the world is not a simple place.
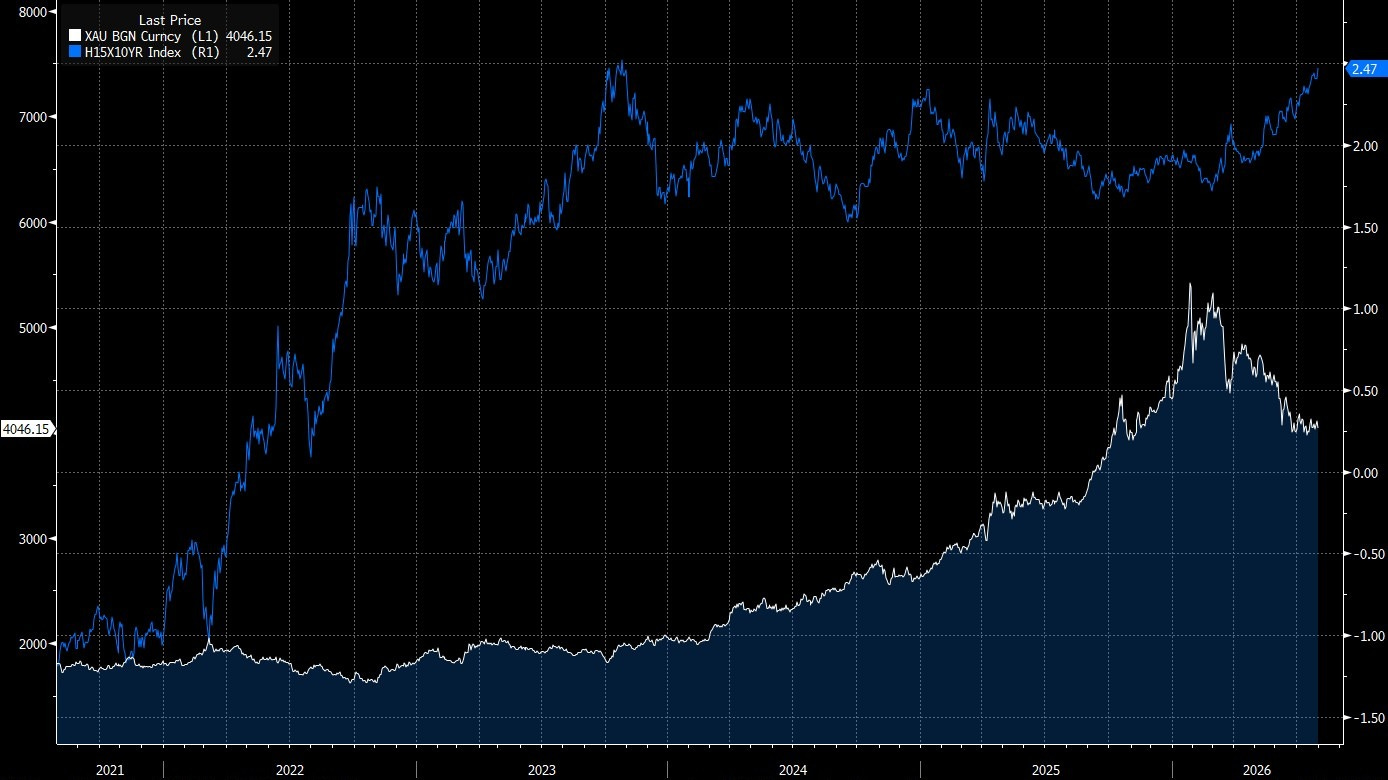
Research indicates that real yields have historically been among the strongest predictors of gold prices. Inflation affects interest rates and other variables, including the dollar, creating second-order effects on gold. Historically, real yields and gold have exhibited a near-perfect inverse relationship. More recently however, during parts of 2024 and 2025, gold continued rising despite higher real yields. The relationship appears to have normalized following the unwind of this year’s early speculative rally.
Supply
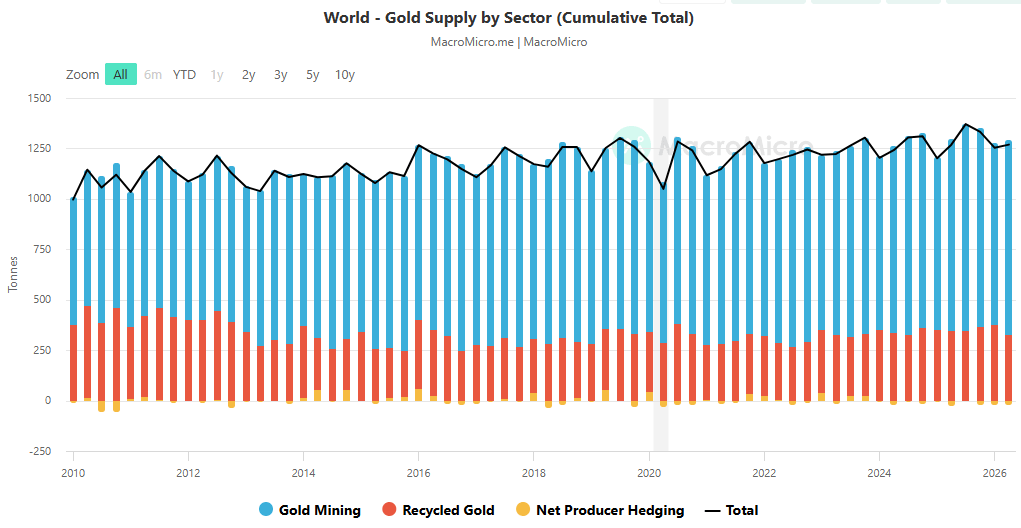
Unlike industrial metals such as copper, gold supply is less constrained. Global supply averages ~5,000 metric tonnes annually and is relatively inelastic. Mining output typically accounts for 70% to 75% of supply, led by production in China and other major mining jurisdictions. Mine supply cannot respond quickly to price changes because new projects often require 10 to 15 years to reach production. The remainder comes from recycled scrap gold. Remarkably, despite gold reaching an all-time high in January, scrap volumes remained flat.
Demand
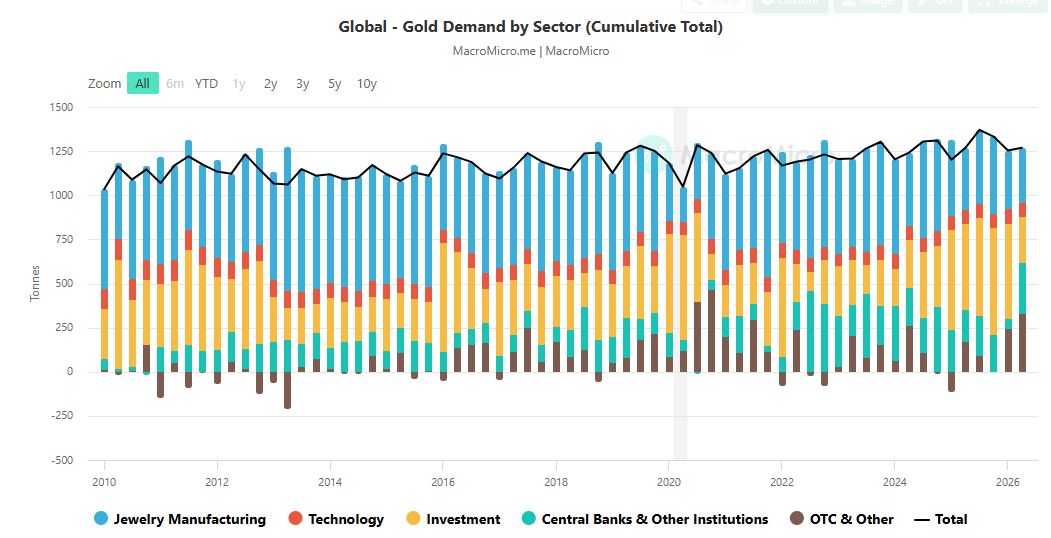
Annual demand typically matches supply across four key sectors. Consumer jewelry accounts for ~50% of annual demand, although its share has declined over recent decades. Private investment and central banks account for ~45%, representing an increasing share over time, while the remaining 5% comes from industrial applications. China is the largest buyer of gold.
The Path Forward
Where are we today? Real yields are near GFC-era highs as the market begins to question the Fed’s credibility in controlling the long end of the curve. The dollar has weakened from its YTD highs amid intervention in the JPY, while oil remains in a seesaw as the conflict moves through a perpetual cycle of escalation and de-escalation. If that were not enough, the midterm elections are approaching.
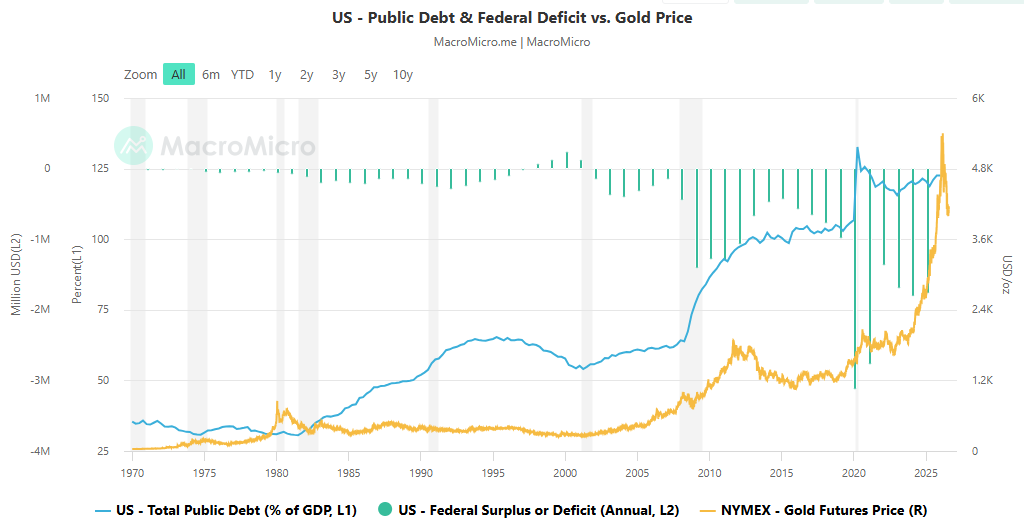
Before getting into my thesis for the remainder of the year, let us first discuss the long-term tailwind for gold. What is the one factor that could prevent gold from crashing? Look no further than national debt. With relentless fiscal expansion and persistent inflation concerns, the debt burden is unlikely to decline anytime soon. This creates a floor for gold as allocators increasingly hedge dollar exposure through the metal.
Now back to my thesis. The Fed’s decision to delay a hike has led participants to question its credibility, sending long-end and real yields toward GFC-era levels. That seems negative for gold, right? Not necessarily. The core rationale for hiking is to combat supply-side inflation caused by the spike in oil. Once, and if, the conflict ends, oil is likely to move lower. Services inflation continues to ease, while economic growth is beginning to decelerate.
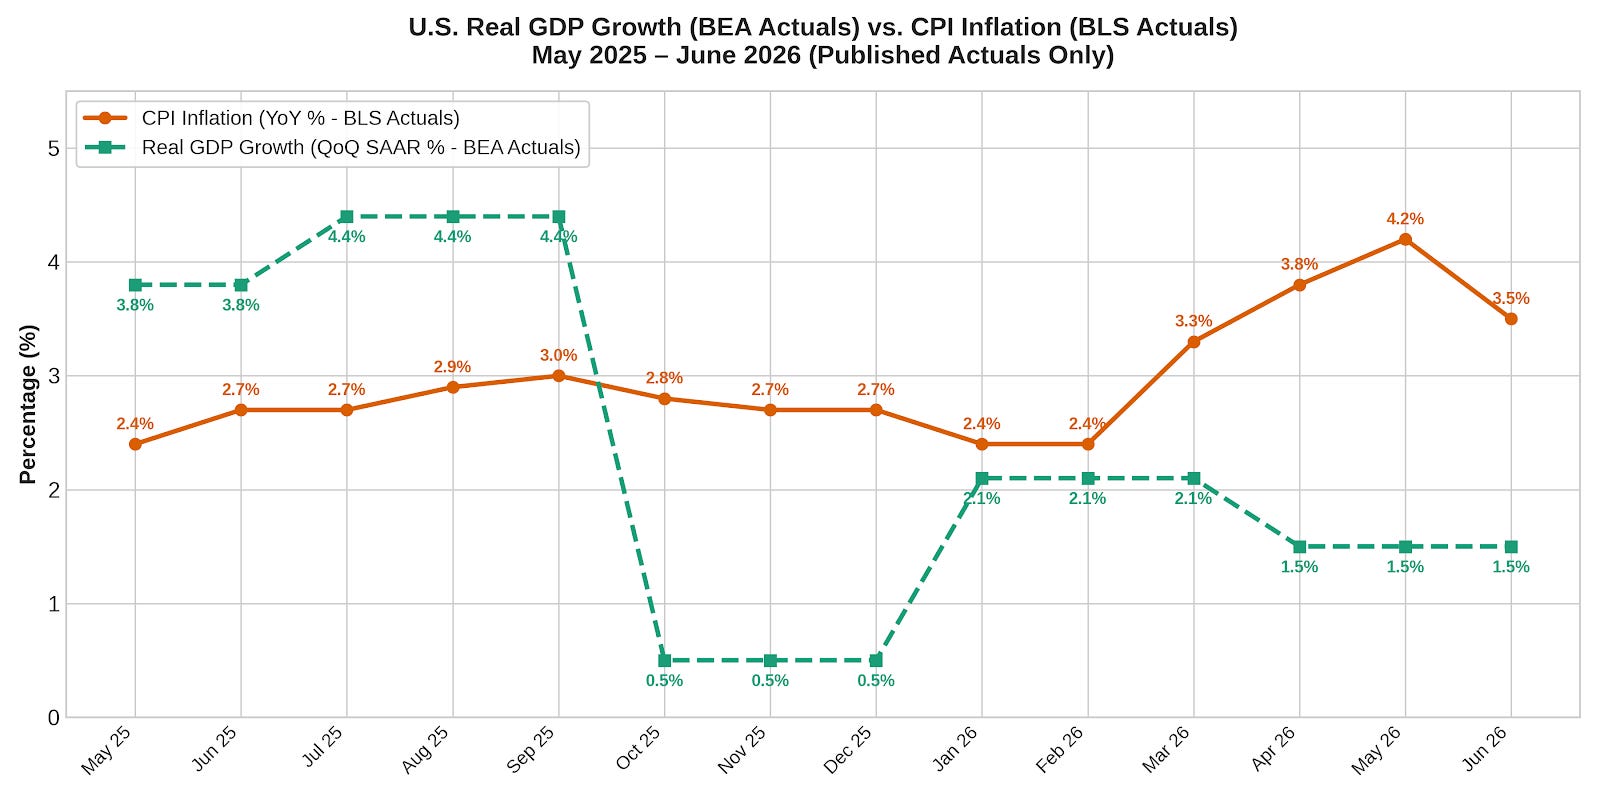
My view is that peak growth and peak inflation for the year have probably passed. The market prices a 72% probability of a September hike and is split on another hike in December. I think the Fed hikes once this year. This could cause long-end and real yields to cool as the Fed restores credibility, benefiting gold. In my view, there is no need to raise rates aggressively.
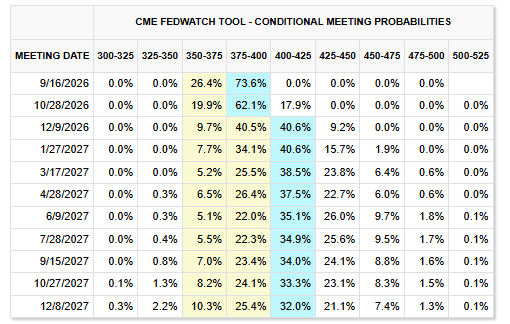
On the other hand, if oil cools sustainably and job growth follows the decline in labor-force participation, I think the Fed would hold rates steady and the long end would adjust on its own.
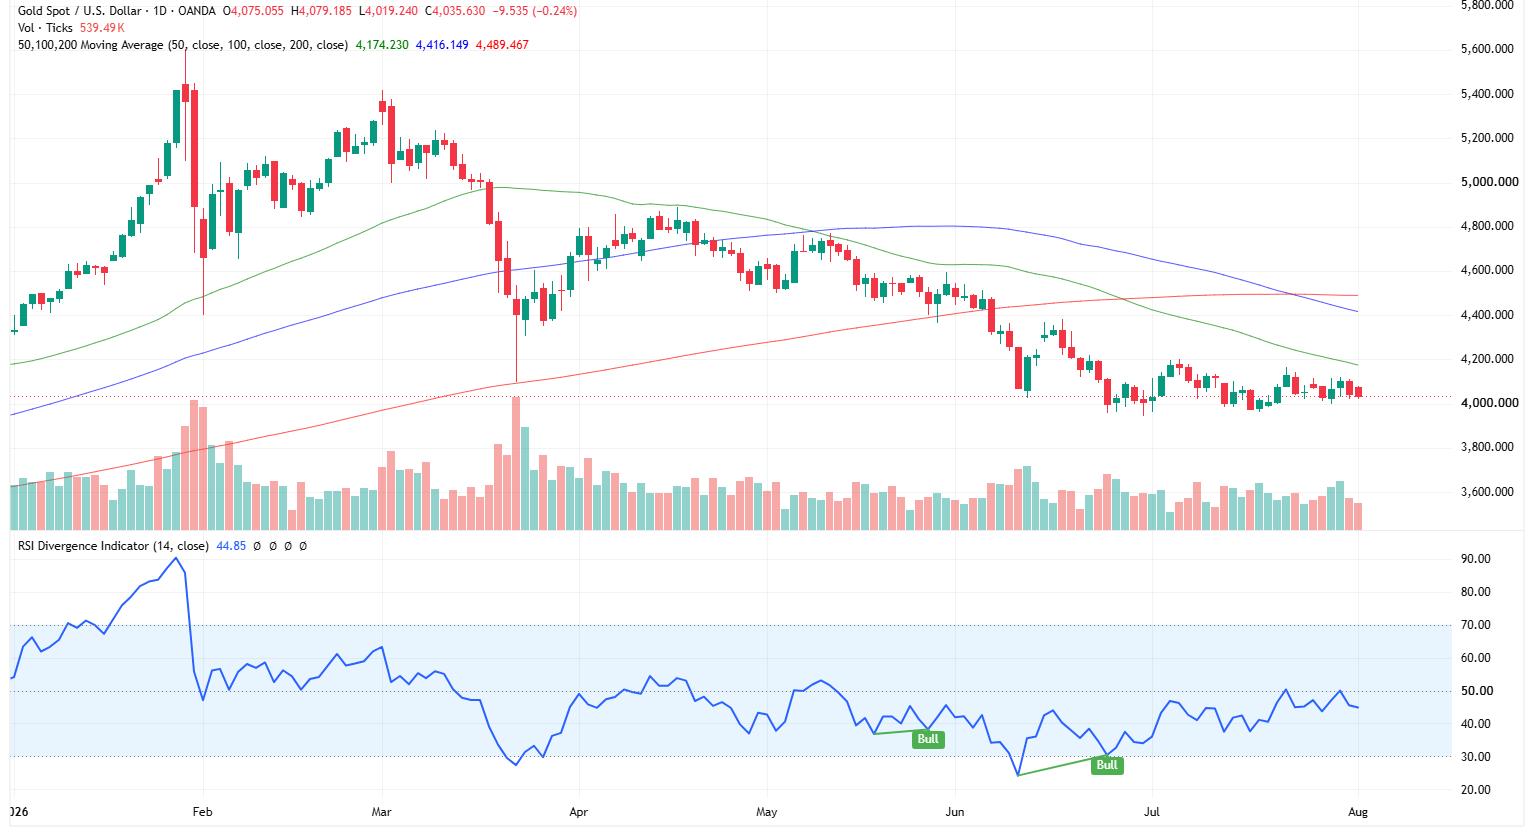
In terms of real yields, gold looks attractive near its $4,000 support level. Under a September hike, which the market views as highly likely, the long end could begin to cool. Under a no-hike scenario, oil has likely entered a more sustained decline.
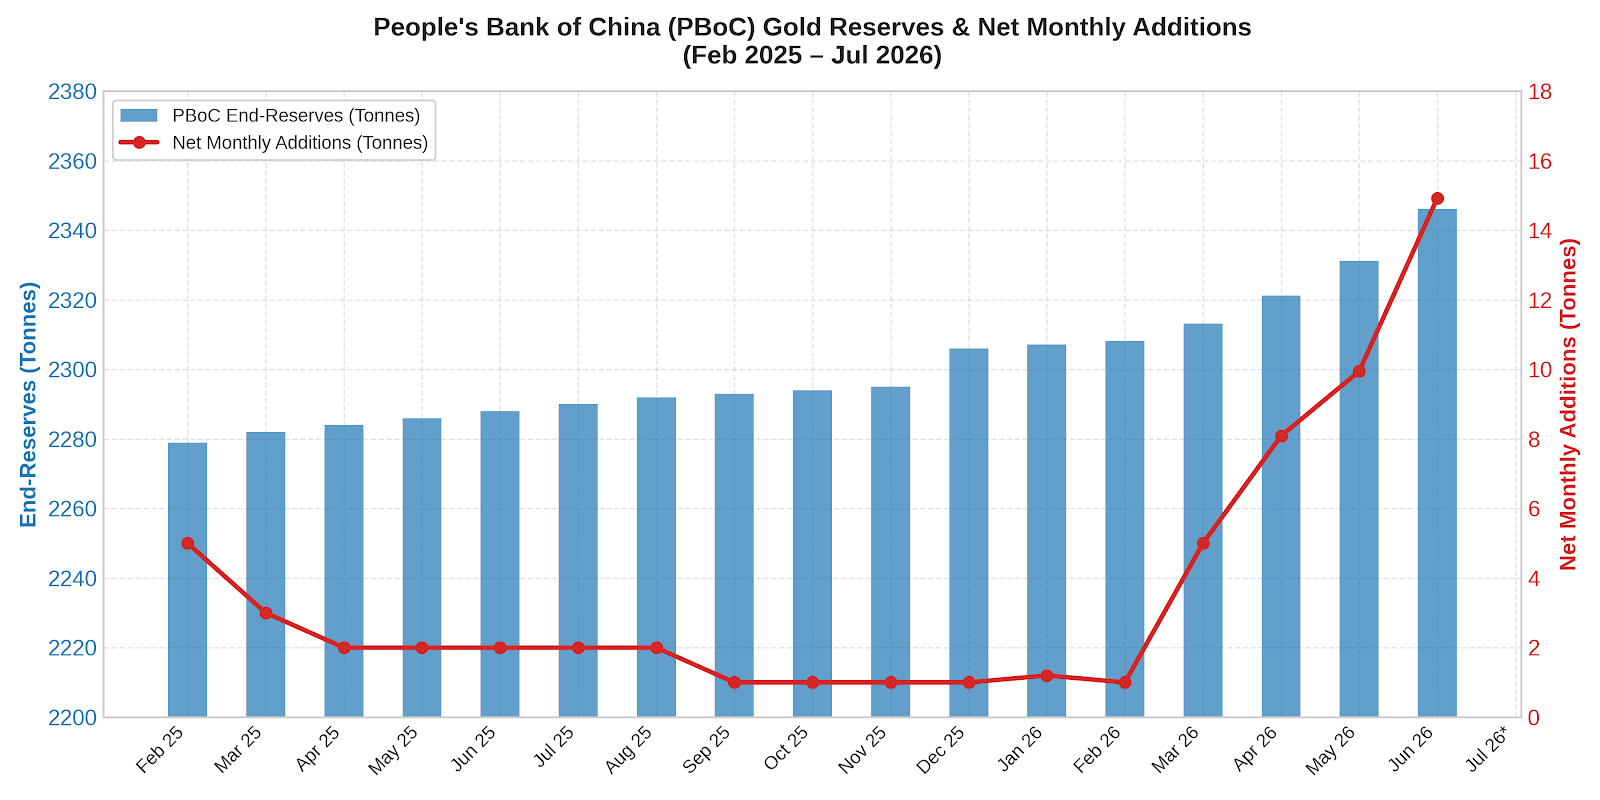
After a muted 1Q26, central banks are resuming purchases at a faster rate. The main driver of it all remains China. The PBOC has extended its purchasing streak to 20 consecutive months, with June marking its largest monthly purchase since October 2023. China appears committed to increasing its gold reserves to support the yuan and hedge geopolitical risks.
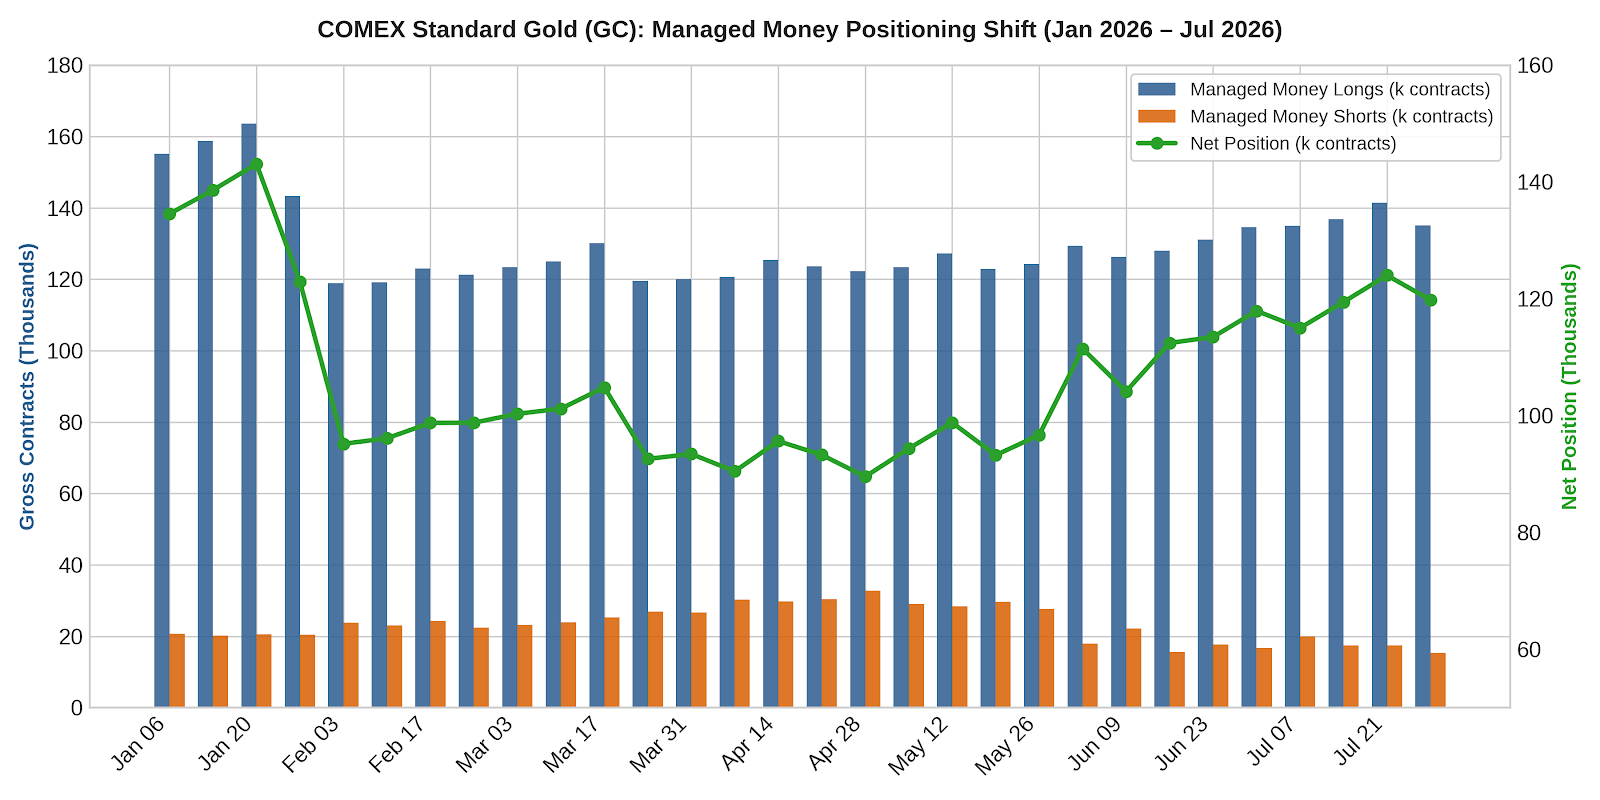
To determine whether a market trend is shifting, look to institutional managed-money positioning through the CFTC Commitment of Traders data. Managed money entered the year with elevated long exposure and underwent substantial deleveraging during Q1. Long positioning was rebuilt through June and July.
Another tailwind for gold is its seasonal performance during midterm-election years. Since the beginning of the available midterm-election data, gold has outperformed the S&P 500 from August through December in 8 out of 12 cycles.
To summarize my thematic thesis, gold has spent 43 trading days below its 200-day moving average. The last time this occurred was between August and October 2023, when the market was pricing in a higher-for-longer rate regime. Following its reclaim of the 200-day moving average, gold recorded its third-longest streak above the level in 50 years, lasting 660 trading days.
I am by no means suggesting that gold will embark on another historic run during the remainder of the year. However, the setup looks compelling. A Fed hike or a sustained decline in oil prices could weigh on real yields, the dollar has weakened significantly amid JPY intervention, positioning is cleaner and now long-biased, China has reaccelerated purchases, and the ever-growing national debt burden, combined with Treasury demand shifting toward gold, has created a long-term floor.
The risk/reward looks attractive, with my first target at flat YTD, or ~$4,300 spot, and a stop-loss at $3,925.
My preferred way to play this setup is through the GLD ETF (calls and shares). For additional beta exposure, below is my list of 2 miners and 1 royalty co trading at attractive valuations.
Watchlist
RGLD - Royal Gold, Inc.
Price: $201.97 | Mkt Cap: $17.1B | EV/FY26E EBITDA: 11.3x | FY26E EBITDA Margin: 82% | P/NAV: 1.2x | Consensus PT: $301.17
Whenever I am bullish on a commodity, I often gravitate toward royalty companies before miners. The reason is simple: you participate in commodity upside with limited capex and operating-cost risk. As gold prices rise, revenue expands against a relatively fixed cost base, allowing margins and FCF to scale without the same exposure to mine-level cost inflation, project overruns, or dilutive M&A. The key is finding a royalty company with experienced management and a strong acquisition record. RGLD has invested ~$10.7B in royalty and streaming assets, with impairments excluding Pascua-Lama equal to only ~1% of invested capital.
RGLD is the third-largest precious metals royalty and streaming company in the world, but trades at a significant 25% to 30% valuation discount to larger peers WPM and FNV. This gap looks too wide for a business with 78% of 2025 revenue from gold, an 82% adjusted EBITDA margin, interests in 367 properties, and 68% of revenue generated in North America. The Sandstorm/Horizon and Kansanshi transactions diversified the portfolio and should drive more than 30% GEO growth in 2026, followed by ~20% organic growth through 2030. RGLD guides to 430koz to 480koz of GEO production by 2030, with further upside from Fourmile, MARA, Great Bear, Warintza, Platreef, and other development assets (50koz+). Its 1.58 beta to gold and 0.56 beta to the S&P 500 support its role as higher-beta gold exposure with lower broad-market sensitivity.
At $201.97, RGLD trades at 11.3x FY26E EBITDA and 1.2x NAV, below its long-term EBITDA range of 14x to 15x. The balance sheet is also rapidly improving. RGLD repaid $300M of debt in 1Q26, could repay the remaining ~$600M by 4Q26, and has authorized a $500M share repurchase program. The Hod Maden restructuring reduced RGLD’s equity stake from 30% to 15% while increasing its NSR royalty from 2% to 4.5%, reducing future capex exposure and bringing the asset closer to RGLD’s core royalty model. If my gold thesis plays out and spot returns to ~$4,300, RGLD offers upside from higher realized prices, accelerating volumes, balance-sheet deleveraging, and multiple normalization.
BTG - B2Gold Corp.
Price: $3.85 | Mkt Cap: $4.9B | EV/FY26E EBITDA: 2.3x | FY26E EBITDA Margin: 58% | P/FY26 Cash Flow: 4.4x | Consensus PT: $6.31
BTG is probably one of the cheapest gold miners in the market. B2Gold operates four mines across Mali, Canada, the Philippines, and Namibia, with Fekola expected to contribute nearly half of 2026 production. Goose is the main growth asset, Masbate provides steady output, and Otjikoto is transitioning from its depleted open pit to the higher-grade Antelope underground deposit. The 2026 outlook has already been reset lower. Goose guidance came in at 170koz to 230koz versus prior expectations of ~250koz, while the April crushing-circuit fire reduced Q2 guidance from 29koz to 18koz to 20koz. Consolidated guidance of 820koz to 970koz is below the 980koz produced in 2025 due to deferred stripping at Fekola, lower Otjikoto output, and the slower Goose ramp.
The stock has absorbed a barrage of negative news: the guidance reset, repeated Goose crushing issues, the April fire, elevated costs, lower Otjikoto production, and another delay to the Fekola Regional exploitation permit. Mali remains the largest risk. Fekola Main is operating normally under the 2012 Mining Code through 2040, while Fekola Regional falls under the more onerous 2023 code and still requires a separate permit. Missing the June 30 deadline placed 60koz to 80koz of 2026 production at risk. Mali’s tax claims, ownership demands, employee detentions, and temporary control of competing assets justify a discount, although B2Gold has settled its outstanding tax and customs assessments and the current dispute affects incremental Regional ounces. At 2.3x EBITDA, the market appears to price the delay closer to a permanent impairment than a timing issue.
BTG’s $2,400 to $2,580/oz AISC reflects $265M of deferred stripping and underground development, the Goose ramp, and ~$525/oz of royalties and production taxes based on $5,000 gold. At my ~$4,300 target, AISC would decline by ~$84/oz to $2,316 to $2,496, leaving margins of ~$1,800 to $2,000/oz. At the midpoint of guidance, every $100 increase in gold adds ~$79M of annualized pre-tax margin after royalties and taxes. Cash generation should also improve over the next several quarters. BTG produced $362M of FCF in Q1 while still delivering ~66koz per quarter under its prepaid sales obligation, which ended in June and could restore ~$110M of monthly cash receipts during H2 at current gold prices. Goose production is weighted toward Q3 and Q4 as throughput reaches ~3,200 tonnes per day, before moving toward 4,000 tonnes and ~300koz of annual production in 2027. At the current valuation, upside is substantial if Goose stabilizes, prepaid deliveries roll off, and gold returns toward ~$4,300, even without an immediate Fekola Regional permit.
AGI - Alamos Gold Inc.
Price: $28.80 | Mkt Cap: $11.6B | EV/FY26E EBITDA: 6.6x | FY26E EBITDA Margin: 69% | P/FY26 Cash Flow: 8.2x | Consensus PT: $46.25
AGI offers low-cost gold exposure with nearly 90% of NAV supported by long-life Canadian assets. Alamos operates the Island Gold District and Young-Davidson in Ontario and the Mulatos District in Mexico, with Lynn Lake under construction in Manitoba. Island Gold is the core asset and represented more than half of H1 production, while Young-Davidson provides a long reserve life and Mulatos contributes lower-cost production from La Yaqui Grande. The company has 15.9Moz of reserves, a 17-year average mine life, and a funded pipeline that could increase production from 545koz in 2025 to ~1Moz annually after 2030.
The stock has fallen ~26% YTD following another guidance reset. Two seismic events and a storm-related power outage damaged access to higher-grade stopes at Young-Davidson, reducing expected H2 mining rates to ~5,000 tpd versus 7,087 tpd in 2025. Young-Davidson’s 2026 production outlook was cut from ~165koz to ~108koz, driving consolidated guidance down from 570koz to 650koz to 510koz to 560koz. Island Gold guidance was narrowed to 290koz to 310koz, while slower recoveries at La Yaqui Grande lowered the Mulatos outlook. Consolidated AISC guidance increased from $1,500 to $1,600/oz to $1,775 to $1,875/oz, primarily due to lower Young-Davidson production, contractor and labor inflation, and ~$10M of rehabilitation and additional ground-support work. The selloff looks excessive relative to the affected asset and the temporary nature of the disruption. Higher mining rates are expected beyond 2026 as the sequence is optimized and additional ground support is installed.
At the midpoint of revised guidance, my ~$4,300 gold target implies an AISC margin of ~$2,475/oz, or ~$1.32B across 535koz of production before taxes and growth capex. Every $100/oz increase in gold adds ~$54M of annual revenue at that production level before higher royalties and taxes. AGI has also eliminated all remaining 2026 hedges and 85% of the legacy Argonaut forward book, leaving only 50koz at $1,821/oz in H1 2027. Cash generation is already strong despite elevated construction spending, with $144M of FCF in Q2 and $245M in H1. The company ended Q2 with $637M of cash, $200M of debt, and $1.2B of liquidity, with another $310M due from the sale of its Turkish assets through 2027. From 2027, the Island Gold shaft ramp should lift underground throughput to 2,400 tpd, followed by the broader expansion to ~500koz of annual district production from 2028. Combined with PDA and Lynn Lake, Alamos targets ~1Moz of longer-term production and an 18% reduction in AISC to ~$1,250/oz by 2028. At 6.6x FY26E EBITDA, the market is pricing a difficult 2026 while giving limited credit to the coming production, margin, and FCF inflection.