


LONG $IAS - Integral Ad Science.
A Contrarian Bet Amid All-Time Low Sentiment in Ad Tech

Integral Ad Science Holding Corp.
NASDAQGS: IAS | 04/11/2025
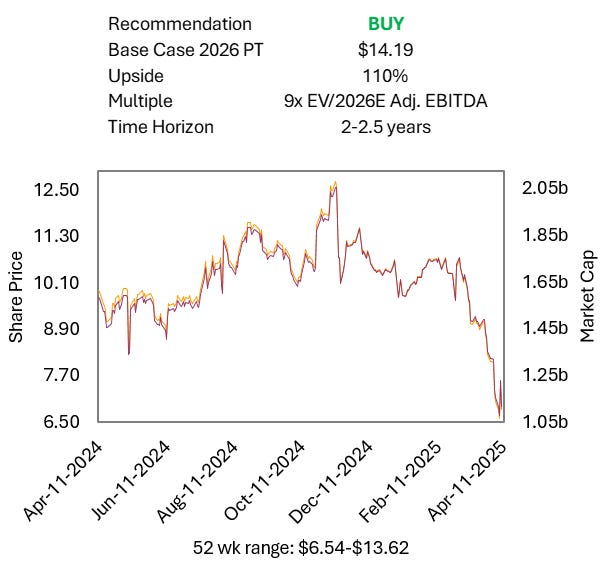

Thesis Summary
IAS has historically traded—and continues to trade—at a ~3x EV/Adj. EBITDA and 0.9x EV/Sales discount to direct competitor DV (DoubleVerify). This valuation gap persists despite IAS outperforming DV in both 4Q results and its FY25 outlook, and even after DV’s ~36% drawdown following 4Q24 earnings and a broader market selloff. I view IAS as a beneficiary of multiple revenue and profitability tailwinds that are expected to materialize over the next three years.
IAS is gaining share through new product launches (e.g., TMQ, Total Visibility) and expanding its customer base by targeting mid-market and international clients. The business is also shifting from commoditized post-bid measurement toward performance-focused pre-bid optimization solutions. IAS’s CPM-based model has shown resilience in past downturns, with verification representing a small fraction of total ad spend and pricing power helping offset impression declines. Publisher growth (via Publica) and CTV tailwinds further support the topline. Speculative catalysts include a potential sale of the company and growing activist interest.
IAS currently trades at a measly EV/Adj. EBITDA of 5.6x for a business that grew Adj. EBITDA at a 23% CAGR over the last 3 years and is set to grow at an estimated 13.2% CAGR over the next 3 years. On an EV/Sales basis, it trades at 2x, for a business that grew sales at an 18% CAGR and is expected to grow at an 11.4% CAGR over the next 3 years.
In my base case execution, a re-rating to 9x EV/Adj. EBITDA—which was the multiple IAS traded at following 4Q24 results—implies ~110% upside over the next 2–2.5 years. I view this as an opportune time to initiate a long position in IAS—a contrarian bet at a time of all-time low market sentiment toward ad tech.
Business Overview
Founded in 2009 amid rising demand for digital ad transparency, IAS was acquired by Vista in 2018 for $850M and IPO’d at $18/share in June 2021.
IAS provides ad verification solutions that ensure ads are seen by real people—not bots—in a brand-safe, suitable environment and the intended geography. Its cloud-based platform serves 2,000+ advertisers and 400+ publishers globally. IAS embeds digital tags in ads to collect and analyze data on context, placement, and user behavior, reporting insights via IAS Signal, which integrates across platforms to improve campaign ROI. It processes 280B+ digital interactions daily.
IAS generates revenue globally, with 69% from the Americas, 24% from EMEA, and 7% from APAC. Revenue is 86% advertiser-facing (pre-bid optimization and post-bid measurement) and 14% from publisher solutions. Ad spend seasonality drives stronger Q4, weaker Q1 revenue.
IAS operates on a CPM-based pricing model, where fixed cost per thousand impressions is multiplied by ad impression volume. Contracts typically range from 1 to 3 years, with minimal revenue from fixed-price arrangements, minimum guarantees, or other custom terms.
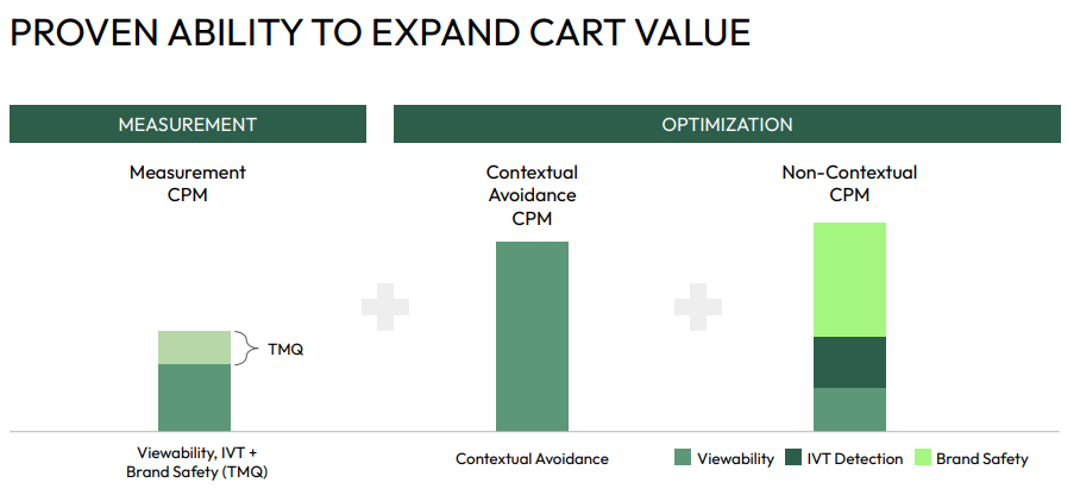
1. Optimization (46% of revenue, +8% Y/Y) - IAS’s pre-bid tools operate in the programmatic stream and filter inventory across DSPs and walled gardens to maximize ROAS (return on ad spend).
2. Measurement (40% of revenue, +13% Y/Y) - post-bid solutions that analyze viewability, ad fraud, and brand safety across formats and channels. By combining pre-bid and post-bid data, advertisers form a feedback loop that enhances future media buying. Integrations span DSPs, walled gardens, and other major platforms.
3. Publisher Solutions (14% of revenue, +20% Y/Y) - IAS helps publishers improve yield by verifying that ad inventory is fraud-free, viewable, and brand-safe. A key offering is Publica, IAS’s SSP and ad server for CTV and video, which enables unified auctions among multiple demand sources. Publica serves over 10 billion CTV ads monthly.
The ad verification industry is effectively a duopoly, dominated by IAS and DV. In June 2024, a once-major competitor, MOAT (acquired by Oracle in 2017), shut down due to product shortcomings and an inability to compete on price. IAS and DV absorbed the majority of MOAT’s clients. DV is 2x the size of IAS by market cap and offers directly comparable solutions. Both firms are private equity-backed, with Vista owning 40% of IAS and controlling 6 of its 9 board seats. Smaller private players include Human Security, Zefr, and GeoEdge.
Ad verification is indispensable as long as digital advertising exists. Large brands running programmatic campaigns must rely on third-party providers to assess pre-bid inventory and measure post-bid performance—especially when millions of impressions are served daily. First-party verification from platforms like Meta and Google poses conflicts of interest, prompting advertisers to demand independent audits. With ad fraud exceeding $100B annually—and ~$0.20 of every $1 wasted on invalid or bot traffic—third-party verification is essential to protect brand equity and campaign performance. IAS and DV also offer advertisers plausible deniability when issues arise.
New entrants face a steep challenge, as IAS’s algorithms are trained on vast swaths of advertiser and publisher data. Its technological focus is underscored by the rapid adoption of Context Control, which reached 100% adoption in 21 months versus DV’s ABS at 36 months. The first-to-market launch of pre-bid TMQ via a Meta partnership in 2024 further highlights IAS’s tech leadership. Its robust patent portfolio—65 issued U.S. patents and 32 pending as of FY24 (up from 51 and 30 in FY23), compared to DV’s 3 issued (up from 2) and 4 pending—further cements its advantage.
Yet, scale is IAS’s most potent advantage. Its technology, expansive workforce, and vast data enable rapid replication of innovation. Selling into large enterprises and maintaining deep client relationships is inherently difficult—winning deals, securing renewals, and embedding into advertiser workflows require long sales cycles and a strong track record. IAS’s scale also helps it overcome key industry barriers, such as maintaining accreditations with industry bodies (e.g., MRC) and integrating across complex systems, allowing it to offer a full-suite solution—from pre-bid optimization to post-bid measurement—as a one-stop shop.
In contrast, niche players like Human Security, lack the ability to consolidate functions or leverage volume to compete on price, despite having supposedly better tech. High switching costs further entrench IAS’s position, as migrating off its platform requires extensive reconfiguration of data processes, workflows, and integrations. This is reflected in the 8.4-year average tenure of IAS’s top 100 advertisers.
Thesis Detail
The IAS business model is more resilient than the market believes:
A key overhang on IAS—common across ad tech—is the perceived impact of tariffs on digital ad spend. For context, S&P forecasts 2025 digital ad growth of +9.1% (vs. +13.8% in 2024), while the IAB projects +7.3% (down from +11.8% in 2024). IAB also noted that 60% of advertisers expect budget cuts of 6–10%, with traditional and social media hit hardest. CTV and online video are expected to be more resilient. IAS guided for +12% Y/Y revenue growth in 2025; DV guided +10%, both in late February.
Furthermore, with the recent announcement of a 90-day pause and tariff exemptions on electronics and other goods, advertisers should gain some certainty (emphasis on some, given today’s unpredictability) as the administration appears to soften its stance. Still, trying to forecast macro policy is futile—it's more practical to assess risk/reward.
The only meaningful post-digital precedent for tariffs was the 2018–2020 U.S.–China Trade War, albeit at a smaller scale. U.S. brands cut ad budgets amid higher costs, while Chinese exporters increased U.S. digital ad spend—spending $5–8B on platforms like Facebook in 2019. Auto and retail ad spend fell 5–7%; traditional media declined 5–6% annually, but digital ad spend still grew 18–25% Y/Y due to the rise of programmatic buying. I doubt we’ll see a repeat of that level of growth today—programmatic is now table stakes, especially for large advertisers.
What matters more is how advertisers reacted: they shifted toward performance-based campaigns, cutting broad brand spend in favor of strategies focused on optimization—a positive for ad verification companies like IAS.
While IAS isn’t immune to slowdowns, its usage-based model (flat CPM × verified impressions) offers structural resilience. As budgets tighten, CPMs often rise due to supply-demand dynamics, partially offsetting impression declines. In contrast, The Trade Desk (media spend-based), and SSPs like PubMatic and Magnite (managed services) are directly tied to total ad budgets. Their revenue contracts when spend falls. IAS, however, charges verification fees equal to just 1–2% of total ad spend (vs. 15–20% for TTD), providing pricing flexibility. Importantly, verification is non-discretionary—brands can’t afford fraud or reputational risk, even in downturns.
In these periods, advertisers scrutinize every dollar, shifting toward higher-quality inventory to maximize ROAS—raising demand for verification and supporting IAS CPMs. These dynamics were echoed during the 4Q24 call and March tech conferences, where CEO Lisa Utzschneider emphasized “performance, efficiency, ROI, and value.” The word performance alone appeared over 30 times in the earnings call.
Auto and retail are again expected to be among the most impacted sectors. IAS has an estimated ~10% exposure to auto, but roughly half of that is international (e.g., Mitsubishi in Asia). That 10% won’t vanish—automakers tend to shift spend from premium to mid-market products, not eliminate it altogether. The impact on IAS should be far less severe than on DSPs or SSPs.
Management likely baked some macro risks into FY25 guidance, which calls for $588M–$600M in revenue (+11–13% Y/Y, midpoint +12%). My base case assumes +9.55% growth, with drivers detailed later. The valuation section outlines a bear case where impressions decline more materially.
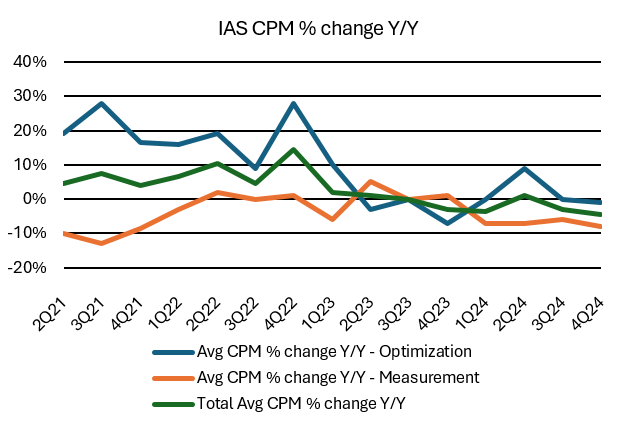
Historically, IAS has proven resilient through ad spend cycles. In 2022, performance-driven optimization outperformed measurement as spend prioritized ROI. IAS also gained from Context Control adoption amid the shift toward contextual targeting. While 2024 revenue lagged top-end ad spend growth, this was partly due to CPM discounts on higher impression volumes—a topic addressed next.

With Pricing Pressures Alleviated, IAS Is Poised to Expand Share:
A key overhang on IAS through 2024 was its price war with DV. Both companies reduced CPMs throughout the year. On its 4Q23 call, IAS noted it had offered more competitive pricing on select large contract renewals—tied to volume commitments and multiyear exclusivity—particularly around the launch of its pre-bid optimization product on Meta’s live feed. Volume-based CPM discounts are standard across the industry and have been used by both IAS and DV historically.
While the market interpreted this as pricing pressure for both, it was likely more acute for DV. IAS strategically undercut on price, while DV’s CEO claimed in 4Q23: “We are not seeing pricing pressure. Period.” Yet DV’s FY24 media transaction fee (MTF, its CPM equivalent) fell -4%, compared to IAS’s -3%. Based on my estimates and expert conversations, IAS CPMs are ~10% lower than DV’s. DV reported an MTF of $0.072 in FY24.
IAS has effectively competed on price before. One expert cited IAS’s role in Oracle Moat’s decline—“ruthlessly undercutting a lot of contracts.” Both IAS and DV offer similar core products; DV’s premium pricing—once tied to perceived quality—has largely eroded. Going forward, for scaled providers like IAS and DV, product innovation and being first-to-market are more important than legacy reputation.
The sharp stock price decline in November 2024 (post-3Q results) was driven by IAS’s guidance cut—from +14% to +11% FY24 revenue growth—following two prior upward revisions. This revision wasn’t due to pricing pressure, but to weaker ad spend in CPG and retail and political advertising crowding out traditional budgets. IAS also took a cautious stance on monetization from new products in 4Q. Ultimately, IAS outperformed, delivering +11.7% Y/Y revenue growth for FY24 and +14% for 4Q24, with improved CPG and retail spend.
DV reported similar macro headwinds in its 3Q and 4Q24 calls. However, retail and CPG weakness persisted into 4Q, with management noting a large CPG client facing significant commodity cost pressures and pulling back on ad spend—resulting in a Q4 earnings miss and a soft +10% FY25 revenue guide.
The price war appears to be over. IAS announced pricing increases in November 2024; DV followed in January 2025. In a scenario of declining ad impressions, CPMs (IAS) and MTFs (DV) should rise on supply/demand dynamics. IAS’s CPMs remain ~10% below DV’s, further supported by DV’s 4Q call: “We expect MTF to continue to decline in 2025... reflecting competitive rates for major new global brand wins, particularly Oracle accounts, and the shift toward measurement and international impressions.”
IAS is unlikely to face further pricing pressure. Its basic measurement offerings were already priced in line with Moat’s at the time of Moat’s shutdown. DV, operating at lower margins, lacks flexibility to cut prices further. In my view, IAS is well-positioned to continue taking share from DV—not only on price, but via its newer offerings and faster innovation cycle (covered next).
Product Innovation, Social and CTV Leadership, and Pre-Bid Expansion Driving Top-Line Growth:
While IAS and DV offer comparable core services, competitive differentiation hinges on innovation, first-to-market execution, and the ability to meet advertisers' growing emphasis on performance—particularly across pre-bid and post-bid solutions. IAS has taken the lead, notably with its Total Visibility product: a pre-bid optimization tool that provides real-time insights into media quality, supply path efficiency, and financial transparency. Unlike DV’s post-bid-only counterpart, Total Visibility enables mid-flight adjustments, reducing wasted spend.
Though not new, Total Visibility has gained traction following strategic iterations post-IPO. It's now frequently cited in earnings calls as a switching catalyst. Marriott, for example, renewed IAS’s social measurement and migrated optimization from what is likely DV. IAS has also tailored this offering for smaller advertisers—emphasizing ease of use and rapid deployment.
IAS’s shift from verification to a performance-focused ad tech partner is accelerating. As pre-bid adoption rises, optimization CPMs—estimated at ~50% higher than post-bid—are proving more durable, especially as measurement becomes commoditized. In downturns, where ROAS matters most, pre-bid tools like Total Visibility should retain strong demand.
IAS also leads in two of the fastest-growing verticals: Social and CTV. Social represents 54% of IAS’s post-bid revenue, growing +25% Y/Y in 4Q24, compared to DV’s +9% growth and 48% mix. With spend shifting from the open web to social—where CPMs are more sensitive—I believe IAS’s lower social pricing has helped it take share. IAS was also first-to-market with early integrations on TikTok and Instagram, riding the short-form video surge.
The company’s Total Media Quality (TMQ) product—a post-bid brand safety solution launched in 1Q23 and expanded through a Meta partnership in 1Q24—offers frame-by-frame live-feed analysis. TMQ commands a 15–20% CPM premium and expanded in late 2024 to Snapchat, Reddit, and Pinterest. Though monetization improves, IAS acknowledges measurement is still volume-driven and is expanding both customer and geographic reach while leaning into pre-bid growth. IAS also benefits from higher-margin open web exposure: 46% of its measurement revenue is tied to open web channels like search, which typically carry higher CPMs and prove more resilient during budget contractions.
On the pre-bid side, IAS was first-to-market with its pre-bid integration for Meta, launched in October 2024 via the Total Media Performance (TMP) product. TMP provides real-time ad quality filtering before impressions are bought and ties directly to Meta’s Ads Manager via API. Crucially, advertisers must use IAS post-bid TMQ measurement in order to activate pre-bid optimization, creating a strong incentive for bundling and reducing the need for incremental SG&A. This integration lock-in dynamic is a strategic advantage over DV, whose pre-bid product only launched in February 2025. IAS is also actively expanding in fast-growing social platforms such as TikTok and Reddit. The company is testing pre-bid solutions on TikTok, including video exclusion lists, and has disclosed that ~50% of TikTok-related revenue is generated outside the U.S.—a differentiator if regulatory uncertainty persists domestically.
CTV is another major growth engine. IAS is integrated with Netflix, Amazon Prime Video, and others as streaming platforms shift to ad-supported models. IAS’s CTV measurement CPMs (~$0.08) are meaningfully above standard formats. As services like Disney+ and Paramount scale ad tiers, IAS is well-positioned to win incremental business. A key differentiator is Publica, IAS’s CTV ad server and SSP. Publica enables unified auctions and deeper publisher monetization—functionality DV lacks. This gives IAS an end-to-end presence in the CTV stack and a natural cross-sell opportunity to post-bid tools. IAS derives 20% of total revenue from publishers (vs. DV’s 9%), highlighting its stronger supply-side position.
CTV remains resilient in downturns. Viewership rises as consumers stay home, and brands seek high-attention inventory. Industry CTV ad spend is projected to grow at a 13% CAGR through FY28; management expects to outperform. I view a 15% CAGR through FY27 as reasonable given its positioning.
Strategic Mid-Market and International Expansion
As ad budgets tighten, advertisers—especially in the mid-market—are shifting toward performance-based campaigns. IAS defines this cohort as accounts beyond its top 100 customers with annual spend in the low end of $200K–$1M range. While large U.S. advertisers are largely saturated in post-bid verification, this performance-driven mid-market remains underpenetrated and represents a meaningful greenfield opportunity.
IAS is actively targeting this segment, hiring over 30 former Oracle Moat employees, including ex-COO Mark Bobowski. Moat had a strong mid-market footprint, and IAS is already reporting double-digit growth in this cohort. The segment could represent a ~$100-$150M revenue opportunity, driven by rising adoption of pre-bid performance tools—with shorter sales cycles and minimal incremental SG&A—IAS has seen strong traction in mid-market, particularly with Total Visibility, its most flexible and widely adopted pre-bid product. This underscores IAS’s more adaptable architecture. In contrast, DV’s enterprise-focused platform is often seen as overly complex and less intuitive for smaller advertisers. Mid-market clients are also highly price sensitive; as noted, IAS is priced ~10% below DV.
Former Moat talent brings existing client relationships that support cross-sell into premium IAS products. At the time of Moat’s shutdown in mid-2024, it generated ~$80M in annual revenue across enterprise and mid-market clients. IAS won 72% of RFPs it pursued (vs. DV’s 70%), capturing ~$40M in revenue. Given IAS’s ability to expand average cart value, this base could be upsold at a ~1.5x revenue multiple over time.
As ad verification matures among large U.S. enterprises, international expansion becomes a critical growth lever—and one where IAS holds a clear advantage. Global brands increasingly require contextual solutions tailored to local languages, regulations, and platforms. While DV touts global expansion, it offers no revenue disclosures and faces challenges due to its complex, enterprise-centric architecture. IAS, by contrast, derives 31% of revenue from EMEA and APAC and is actively expanding its presence in high-potential regions.

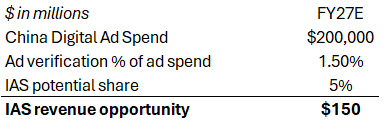
One such opportunity is China, the world’s second-largest ad market with $140B in 2024 digital spend (eMarketer, Nov. 2024). IAS is currently in alpha testing and plans to offer localized support to Chinese advertisers seeking global reach. This follows recent APAC expansions into Hong Kong, Taiwan, Thailand, and Vietnam. IAS’s strategy—“China In and China Out”—positions it to enable both inbound and outbound advertising. While the ongoing U.S.-China trade dispute clouds near-term visibility, IAS’s long-term commitment and prior international success support the view that China could represent a $150M revenue tailwind by FY27 if IAS captures just 5% market share. Though this is not included in my base case revenue build due to macro uncertainty, the long-term opportunity remains compelling.
Revenue Build:
Tying together the top-line thesis, I forecast +9.55% Y/Y revenue growth in FY25, driven by strong optimization momentum, partially offset by advertiser caution impacting measurement (+5.74% Y/Y). As macro visibility improves, I model reacceleration to +11.41% in FY26 and +13.17% in FY27.
CPMs: Optimization CPMs should remain resilient, supported by rising adoption of premium pre-bid products like Total Visibility and Meta TMP. I model CPM growth of +4% in FY25, +2% in FY26, and +1% in FY27—a cumulative +7% lift from FY24. Measurement CPMs are expected to rise +2% in FY25 on supply/demand tailwinds, then hold flat as discounts offset premium product mix (e.g., TMQ). I estimate a +3.8% cumulative CPM uplift (~$0.0025) from FY24–FY27. Even so, my base case assumes a conservative blended CPM of $0.0677 in FY27, ~6% below DV’s FY24 MTF.
Impressions: Optimization impressions are set to grow +8% in FY25, +10% in FY26, and +12% in FY27, driven by mid-market expansion and scaling social pre-bid. Measurement impressions should slow to +4% in FY25, then recover to +10% and +13% in FY26 and FY27 as confidence returns. By FY27, I expect IAS to add 949B optimization and 1.2T measurement impressions versus FY24.
Publisher Revenue: CTV (especially via Publica) should remain resilient, supported by streaming tailwinds. I model +14% growth in FY25, +15% in FY26, and +16% in FY27, reflecting continued adoption and product momentum.

Well-Positioned for Continued Profitable Growth
IAS exited FY24 with $191M in Adjusted EBITDA and a 36% margin, exceeding its 4Q23 guide of $171–$179M (33% midpoint), despite delivering +12% Y/Y revenue growth vs. its initial +14% target. For FY25, management guides to $202–$210M in EBITDA (35% midpoint). I believe this is again conservative—IAS is likely to exceed margin expectations even in the event of weaker ad impressions or a revenue guidance cut.
A key margin driver is growing adoption of performance-based pre-bid products (e.g., Total Visibility, social optimization), which carry ~50% higher CPMs than measurement with similar cost structures. My base case assumes +4% growth in optimization CPMs in FY25, generating operating leverage that offsets slower measurement growth. While revenue sharing with DSPs remains undisclosed, I conservatively model 50bps gross margin compression to 78.0% in FY25, followed by +75bps annually in FY26–FY27 as volumes scale and fixed costs are absorbed.
Cross-selling between pre-bid and post-bid solutions within the enterprise customer base further supports margin durability, as these deals avoid costly RFP processes. Meanwhile, mid-market expansion offers structurally higher ROI due to shorter sales cycles and lower incremental S&M costs. As a result of this, I anticipate S&M/Revenue to improve 100bps in FY26 and FY27. In contrast, DV’s exclusive focus on large enterprise clients results in higher S&M as a % of revenue (25.5% vs IAS’s 23%) and lower EBITDA margins (33% vs IAS’s 36%).
Another reason I believe guidance is conservative is due to a likely overestimation of G&A. While IAS has room to improve its G&A/Revenue (currently 18% vs. DV’s 14%), the recent hiring of 30 senior Moat employees could push FY25 G&A higher. That said, given the broader macro backdrop—with rising layoffs and hiring freezes across tech—IAS may follow suit in controlling overhead. For conservatism, I model G&A at 18.5% of revenue in FY25, up 69bps from FY24 and expect 100bps improvements in FY26 and FY27.
My base case forecasts $208.8M in FY25 Adjusted EBITDA, reflecting a 35.96% margin—at the top end of management’s $202M–$210M guide. I expect further margin expansion of 95bps in both FY26 and FY27.

Valuation Discount Relative to DV Set to Close
Prior to DV’s disappointing 4Q24 report and the broader market downturn, IAS traded at a steep valuation discount—roughly 5–8x lower on EV/EBITDA and 1-1.5x lower on EV/Sales. Some of this gap stemmed from size (DV is ~2x larger) and sector classification, with DV grouped under "Software" and IAS under "Communications," the former commanding higher multiples.
The primary driver of DV’s premium, however, was faster historical revenue growth, largely due to its first-mover advantage. DV launched its pre-bid programmatic product (Pre-bid IQ) in 2015, a year before IAS, enabling it to scale faster and capture early share. IAS’s broader international exposure also weighed on growth in 2022 as EMEA and APAC softened. DV’s top-line growth has also been partially inorganic, with acquisitions masking true organic trends.
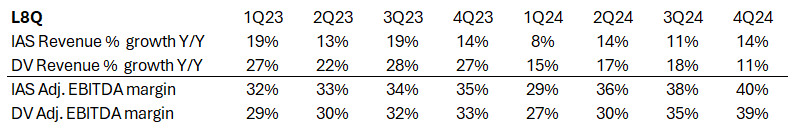
That gap is now closing. In 4Q24, IAS outgrew DV on revenue. IAS has also outperformed on profitability, with higher adjusted EBITDA margins for eight straight quarters. FY24 margins improved from 33.6% to 36.1% for IAS, while DV remained flat at 33%.
Importantly, the quality of IAS’s earnings is superior. Adjusted EBITDA ex-SBC margin for IAS is 24.8% (8x multiple) vs. DV’s 19.5% (15x). If budgets tighten further, DV is more exposed due to its reliance on enterprise clients for impression volume and its ~10% CPM premium, which limits pricing flexibility without pressuring margins.
Valuation
IAS may revise FY25 revenue guidance to ~10% Y/Y, but I don’t believe this would be viewed as bearish. The market has already priced in macro weakness, and IAS retains multiple levers to outperform on margins. Given near-term uncertainty, anchoring valuation on FY26 performance is more appropriate.
If my base case plays out, IAS should re-rate to 9x FY26E Adj. EBITDA, consistent with its multiple post-4Q24 results before the broader selloff. This reflects a company expected to grow EBITDA at a 13.2% CAGR through FY27 and remains conservative relative to IAS’s historical average of ~13x. A re-rating to 3.3x EV/Sales is also justified by sustained low-double-digit revenue growth.
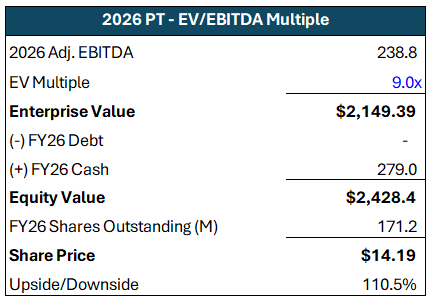
This implies +110% upside over 2–2.5 years—a sharp rebound from the –37% drawdown following strong 4Q24 results and positive FY25 guidance. As macro conditions stabilize, confidence in FY26 forecasts should build, supporting multiple expansion. Additionally, incremental margin gains and operating leverage should drive stronger cash generation.
Bull Case:
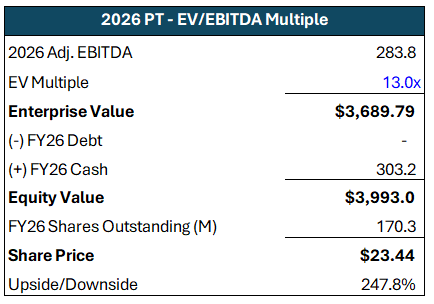
I project revenue growth of +13.5% in FY25, +15.6% in FY26, and +17.5% in FY27. Adj. EBITDA margins should expand to 39.6% in FY25, with 120bps improvements in each subsequent year. This implies a 21.5% Adj. EBITDA CAGR through FY27. Applying a 13x multiple—aligned with IAS’s historical average—yields a bull case price target of $23.44, implying +247.8% upside.
Bear Case:
In a bear case scenario, FY25 revenue declines -2.6% Y/Y, marking a sharp reversal from FY24 levels. Modest recoveries follow, with +3.88% growth in FY26 and +3.94% in FY27. This scenario assumes the pre-bid performance opportunity fails to materialize, with optimization impressions declining –2% in FY25 and growing only +4% Y/Y in both FY26 and FY27, with flat CPMs across the period.
Measurement revenues are expected to fall –6.02% Y/Y in FY25, followed by modest growth of +3.79% in FY26 and +3.91% in FY27. I also model a –2% CPM decline in FY25, with no recovery through FY27. Measurement impressions decline –4% in FY25, then stabilize at +4% annual growth thereafter.

On Adjusted EBITDA, I anticipate IAS to report $167.63M in FY25, implying a 32.4% margin. I expect margins to decline a further 20bps in FY26 and 200bps in FY27.
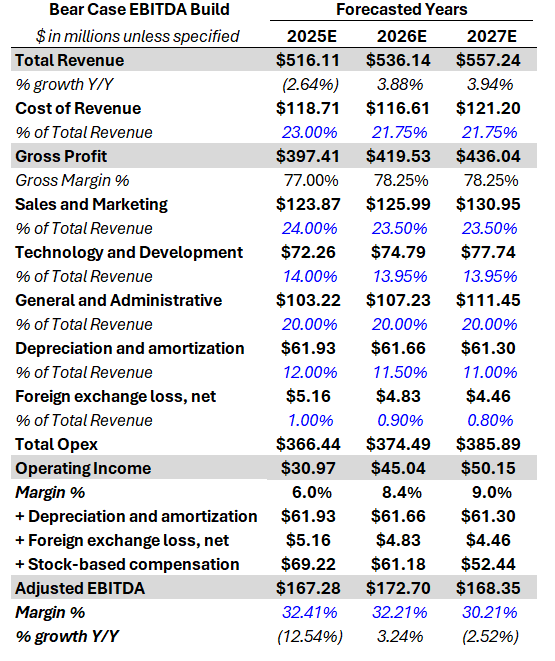
That said, I view this outcome as highly unlikely. Even with the broad equity market drawdown—especially in advertising-related names—much of the downside risk is already priced in. In this scenario, a 5x EV/EBITDA multiple on FY26 is still reasonable for a company generating >30% margins, which I believe IAS can sustain, as costs remain controlled even under weaker top-line growth.

The risk/reward remains highly attractive: over +110% upside in 2–2.5 years in the base case versus just –5.4% downside in the bear case.
KKR Buyout Rumors not Dismissed; Potential Activist Involvement
In October 2024, Bloomberg reported that IAS was exploring a sale. By November, it was reported that KKR submitted an offer-though no deal materialized, the offer has not been formally dismissed. Given Vista’s controlling stake and potential desire for an exit, the door remains open. With IAS trading near all-time low EV/EBITDA multiples despite strong execution, a few solid quarters followed by continued market disregard could reignite sale talks.
Private equity activity has slowed in early 2025, awaiting macro clarity, but is likely to pick up later this year. Should that happen, IAS could command a 9–11x FY25E Adj. EBITDA multiple.
Separately, Rubric Capital Management disclosed a new ~1.97M share stake in IAS (1.2% of market cap) in 4Q24 13F filings. While a small position for Rubric (~0.26% of its portfolio), the firm has a history of value-driven activism in out-of-favor sectors. Given Rubric’s track record and IAS management’s silence on buyout rumors, pressure for a sale can’t be ruled out.
This remains speculative and outside the core thesis, but the rationale is simple: IAS continues to trade ~3x below DV on EV/EBITDA, despite taking share, outperforming on both 4Q results and FY25 outlook, and expanding GAAP profitability. With G&A still at 18% of revenue versus DV’s 14%, there’s also room for cost optimization—making the case for strategic interest or activism even stronger.
Risks
Effectiveness of Ad Verification Solutions
In February 2025, Adalytics published a scathing report alleging that both IAS and DV failed to prevent ads from appearing alongside explicit and illegal content. The report raised serious concerns about the effectiveness of their brand safety tools. IAS responded by noting that of the 1.9 billion webpages observed over 60 days, just 88,000 (0.0046%) were flagged from the cited domains. While this confirms the issue exists, it also underscores its limited scale. More broadly, it reflects the inherent complexity of programmatic advertising—where impressions pass through multiple intermediaries and duplicate paths before reaching the buyer. With millions of publishers and auctions involved, complete oversight is nearly impossible.
Adalytics further claimed that IAS and DV don’t provide full page-URL-level transparency, making it hard for brands to pinpoint exactly where ads ran. While true in some cases, IAS has offered full URL reporting since 2021 through its Brand Suitability product—though adoption depends on customer settings. Providing all URLs is often impractical due to data overload, and many publishers withhold them due to privacy and competitive concerns. URL-level reporting helps, but it isn’t a standalone fix. The better solution is robust pre-bid filtering to prevent unsafe placements upfront—an area where IAS is already expanding.
It’s worth noting that Adalytics positions itself as an industry watchdog while also selling its own solutions—giving it a clear incentive to provoke concern. No independent party has validated the effectiveness of Adalytics' tools. Despite years of publishing headline-grabbing reports, none have meaningfully impacted the growth trajectories of IAS or DV. This suggests that while Adalytics may serve a purpose in raising awareness, the challenges of ad verification at scale are well known. IAS and DV continue to deliver real value by protecting brand equity and combating fraud across billions of impressions. Unless a new entrant can outperform them at scale—and match their technological integration and sales relationships—I see little risk of near-term (2–3 year) market share loss to emerging competitors.
Red Flag: Insider Selling
This isn’t a core risk, but it’s worth flagging. IAS’s insider transaction history shows no open market insider purchases—only consistent sales, likely tied to 10b5-1 automated trading plans. While the absence of insider buying may suggest limited confidence, this trend is common among tech companies. In IAS’s case, ~90% of CEO compensation is in stock, which partly explains the selling activity.
Macro Overhang: Thesis Hinges on Certainty in FY26
The most material risk is that the thesis depends on advertiser certainty returning in FY26. The current policy landscape remains unpredictable, with frequent shifts creating a risk-off environment for marketers. While I believe some clarity will emerge within the next year, there’s no guarantee. That said, at current levels, I view the risk/reward of a small, long position as compelling, even with this uncertainty priced in.
Summary Base/Bull/Bear Cases:

Disclaimer: Nothing posted by P14 Capital should be considered financial advice. Please consult a financial advisor and/or conduct your own due diligence before making investment decisions.