


LONG $IAS - 1Q25 Earnings Update
Solid Q1; Thesis on Track, 80% Upside Potential

Integral Ad Science Holding Corp.
NASDAQGS: IAS | 05/16/2025


Amid all-time low sentiment in ad tech—IAS delivered a solid set of 1Q25 results. The stock is up 20% since the pitch date (04/11, $6.74) on the broader market rebound, yet the muted reaction to 1Q25 results underestimates the resilience and potential for outsized growth in IAS’ business model. Please refer to the core thesis for background:

IAS shares were flat the day after reporting, despite impressive revenue growth and margins. Revenue came in at $134.1M (+17.1% Y/Y), beating estimates by $4.77M, while GAAP EPS of $0.05 topped the consensus by $0.02. The subdued market response likely reflects management’s only marginal uptick to FY25 guidance—a conservative stance given that advertiser uncertainty still lingers:
Revenue of $590M-$600M (midpoint: +12.2% Y/Y) vs. prior $588-$600M (midpoint: +12% Y/Y)
Adj. EBITDA of $204M-$210M (midpoint: +8.2% Y/Y, 34.8% margin) vs prior $202-$210M (midpoint: +7.7% Y/Y, 34.6% margin)
Maintained Gross Margin guidance at 77%-79%
While I’m short-term bearish on large-cap equities—which could pull IAS lower given its correlation with the broader large cap market—I remain confident in the long-term thesis. New catalysts and positive developments this quarter only strengthen my view.
The Positives
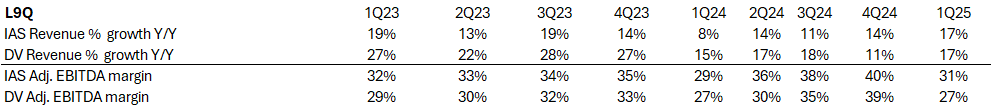
Thesis playing out well as advertisers shift to performance focus - A major contributor to this quarter’s impressive +17.1% Y/Y total revenue growth was optimization, IAS’ pre-bid stack. Optimization revenue jumped +23.5% Y/Y on +26% Y/Y impressions with flat CPMs and now sits at 48 % of total revenue. Key vertical strength came from financial-services/insurance, retail, and travel & entertainment. Notably, retail and travel ramped spend even in an uncertain macro environment—two sectors most exposed to tariff/macro risk—showing that advertisers are doubling down on performance.
IAS is leaning harder into becoming a full-scale performance engine with:
The launch of Dynamic Performance Profile (DPP), which bundles the best-performing contextual segments; early testing shows a 34% jump in conversion rate and a 26% drop in eCPMs (spent by the advertiser.)
Audience-enriched contextual targeting, rolled out in Q2, lets customers light up their most engaged segments inside their DSPs using contextual clues. A March case study with a travel client showed placements featuring audience-enriched segments delivered a 159% higher success rate at 72% lower cost.
Expanded pre-bid integrations with Amazon DSP and DV-360, + a global rollout of Meta content-block-list optimization. TikTok pre-bid video-level exclusion lists are now in general availability. TikTok’s future in the U.S. is now less uncertain, with continued extensions granting time for a potential U.S. acquisition. About 50% of IAS TikTok revenue already comes from outside the U.S. TikTok itself is a massive opportunity, with ~$30B in ad spend expected on the platform in 2025 and projected to grow to ~$50B by FY-27. Assuming a conservative 25% IAS share (this is conservative since IAS and DV effectively form an ad-verification duopoly), the TikTok revenue opportunity could reach ~$188M by 2027. Note that this opportunity is already being capitalized on, as IAS has been integrated with TikTok since 2021.

Expanded the Reddit partnership to add viewability and invalid-traffic (IVT) measurement—complementing the TMQ post-bid product and establishing the measurement loop needed for future pre-bid—and, in parallel, announced a strategic first-to-market partnership with Nextdoor, extended brand-safety screening to the Google Search Partner Network, and launched new pre-bid tools on Spotify.
Initial adoption of optimization products by former Oracle Moat customers remains strong, with management noting that these clients are being cross-sold Context Control and other optimization add-ons and are adopting them rapidly.

Management expects pre-bid revenue to keep scaling through 2025 and become meaningfully larger in 2026.
Margins continue to impress. 1Q25 adj. EBITDA grew +26% Y/Y to $41.5M, with margin at 31%—a 211 bps expansion Y/Y. Outsized revenue growth lifted EBITDA dollars, but the bigger story is the minimal incremental sales-and-marketing spend required—i.e., S&M efficiency. Sales and marketing as a % of revenue fell 380 bps Y/Y to 24% from 27.8%, even as management expands its footprint to reach mid-market customers. These mid-market clients are performance-based, lower-touch, and feature quicker sales cycles, as noted in the core thesis. Management is wisely using an inside-sales model for this segment instead of the high-touch approach reserved for larger enterprise clients.
IAS once again beat peer DV on margins, yet the ~3× EV/EBITDA valuation gap persists. DV delivered +17.2% revenue growth, maintained its +10% Y/Y revenue guide, and EBITDA margins were flat Y/Y. Despite IAS now projected to grow faster with meaningfully higher margins, the market still favors DV—likely a size bias (DV’s market cap is ~2x IAS). It may take more quarters of consistent top and bottom-line outperformance, plus stronger cash generation, for IAS to close or reverse that valuation gap.
International & mid-market expansion tracking nicely. One of IAS’s key differentiators is its global footprint. A month ago this was viewed as a headwind amid tariff noise; today, a softer trade stance and new trade deal negotiations point to upside. International revenue rose +18.5 % Y/Y, driven by EMEA +23.6 % Y/Y. APAC was up just +2.5 % Y/Y as many APAC retail brands reduced spend in the US. This, however, stands to change with the new softer stance toward China and other trade-deal partners. At a 145% tariff, APAC-based retail spend in the U.S. was minimal; at ~30% for China and a presumably lower than April 2nd rate for other countries in the region, APAC advertisers should resume advertising ahead of the holiday shopping season.
China alpha test. IAS kicked off alpha testing in China in late 2024 with luxury-goods clients and is “receiving very encouraging feedback.” On 04/01 it hosted its first IAS China event in Shanghai with 40+ brands and agencies—split between local campaigns and “China-out” strategies. Headcount is ramping to support the push. With the entire 2025 product roadmap already shipped in 1H25, first China client wins could land by year-end, riding the seasonal Q4 surge. I size the China Revenue opportunity as $150M by FY27E (see core thesis)
Mid-market momentum. As noted earlier, these are performance-heavy advertisers laser-focused on ROAS and are adopting pre-bid optimization products quickly. Management notes that prior Oracle Moat mid-market customers are onboarding and are being cross/up-sold pre-bid services rapidly. Automation investments are simplifying activation, and this mid-market strength helped push advertiser NRR to 109 % in Q1.
Publisher revenue accelerating. Publisher revenue grew +33 % Y/Y, driven mainly by Publica, IAS’s CTV/video SSP and ad-server. Management attributed the lift to (i) incremental CTV inventory coming onto the platform, (ii) higher adoption by existing Publica partners, and (iii) early cross-sell of publisher-measurement products such as TMQ. Stand-alone publisher-measurement revenue advanced mid-single-digits as new CTV partners deploy TMQ post-bid ahead of optimization; every major Publica client is already in that pipeline. Management expects publisher revenue to outpace total IAS again in 2H25 as further integrations go live and EMEA CTV adoption converges toward U.S. levels, but growth will be lower than Q1 due to the timing of prior Oracle moat customers being onboarded. Direct rival DV’s supply-side revenue likewise grew +35% Y/Y—even without an owned SSP— driven by strong uptake of its CTV measurement suite among large enterprises.
Management also flagged a speculative catalyst: the regulatory-driven breakup of Google’s ad stack could push publishers toward independent ad servers like Publica, providing further upside to publisher revenue.
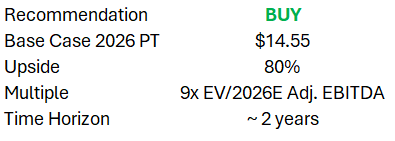
Cash position inflecting. Management has focused on cleaning up the balance sheet for the past few years, with all outstanding debt expected to be repaid this year. As GAAP net income inflects upward and working-capital discipline holds, IAS is well positioned to grow free cash flows. My base case projects $96M in FCF (OCF – capex on PP&E + intangibles) for FY25, +24% Y/Y. That sets the stage to revisit the private-equity interest (e.g., KKR) rumored late last year. IAS has nearly every trait PE firms covet in late-stage software: expanding GAAP profitability, soon-to-be cash-cow status, a sticky product (109% NRR), a healthy balance sheet with room for leverage, and exposure to secular industry growth (digital advertising, CTV, programmatic.) My only concern—given today’s near all-time-low valuation—is a sale that undervalues the business. In an acquisition scenario, 9x EV/2026E adj. EBITDA strikes me as a fair floor.
The Negatives
Downside in CPMs. In my original thesis, I expected impression volumes in both Optimization and Measurement to stay muted, with rising CPMs bridging the gap; 1Q25 delivered the opposite. Optimization revenue rose +24% Y/Y on a +26 % jump in impressions, with CPMs flat. Measurement grew just +4% Y/Y: impressions were up +25%, but CPMs dropped –13%. Management pointed to lower-CPM, smaller-budget campaigns from emerging markets and highlighted that open-web display (42% of Measurement) slipped low single digits as spend shifted toward higher-ROI Optimization. Volume—rather than price—drove the quarter, resulting in a blended -7% Y/Y CPM decline across Optimization + Measurement. DV reported a similar pattern, with its Media Transaction Fee down –6% Y/Y, indicating this is an industry-wide pricing headwind, not an IAS-specific misstep.

Conservative guidance. Despite the solid Q1 performance on both the top and bottom line, IAS nudged the FY25 outlook only slightly—revenue midpoint now +12.2% Y/Y (up 20 bps) and adj. EBITDA midpoint +8.2% Y/Y (up 50 bps). The Q2 guide calls for $142–144M revenue (+11% Y/Y) and $45–47M adj. EBITDA (~32% margin), a clear step-down from Q1’s +17% growth. When pressed about tame Q2 growth expectations in the Q&A, the CFO reiterated that Optimization will grow “double-digits but below Q1’s 24%,” Measurement “mid- to high-single-digits,” and Publisher “a little bit less” in Q2 as Oracle onboarding laps, adding that open-web display remains soft and macro visibility is limited. Management expects sequential revenue acceleration in 2H25 but is keeping the bar low near-term.
I see the revenue guidance as overly cautious. Trade-deal progress points to a stronger holiday season, APAC could re-accelerate, and performance-focused product adoption is far from saturated. EMEA should stay robust as EU consumers recover with inflation contained and central banks engaging in QE.
Management has historically been conservative on EBITDA guidance: FY24 adj. EBITDA margin finished 36% versus the initial 32.7% guide (a 330 bps beat). The current FY25 margin guide of 34.6% bakes in macro uncertainty and incremental G&A, yet continued S&M efficiency and disciplined headcount via the new inside-sales model could again drive upside.
Updated Valuation Drivers
Revenue Build:
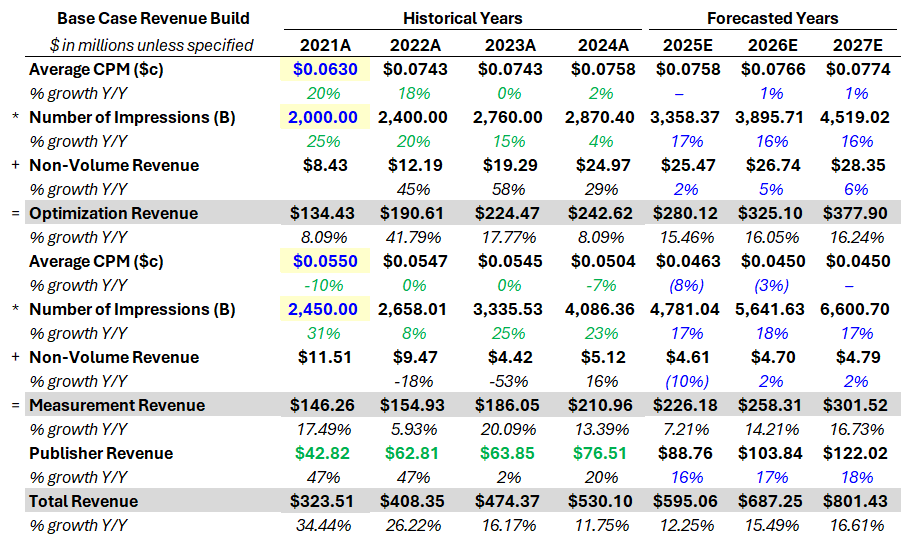
Key changes: CPM growth for Optimization is flat in FY25 as impression supply holds stronger than expected; if impressions roll over, I expect CPMs to tick up and offset part of the volume loss. I have raised my impression-growth assumptions for Optimization—expansion into social (Meta, TikTok) and further penetration in APAC/EMEA should keep impressions strong. In Measurement, average CPMs decline on mix shift toward international markets and smaller advertisers, but this is offset by healthy impression growth; supply-demand dynamics should still push CPMs higher if impressions soften. IAS’s TMQ continues to land on new ad platforms such as Reddit, so the impression-growth runway looks solid. On Publisher, I expect Publica to keep riding CTV tailwinds, with the speculative Google ad-stack break-up offering additional upside. Note that my FY25E revenue-growth forecast aligns with management’s midpoint; while I view the guide as conservative, macro visibility remains limited and advertiser uncertainty is still elevated. For FY26–27, I’m more optimistic: Optimization momentum should persist, Measurement rebounds as macro certainty returns, and Publisher revenue continues to grind higher.
EBITDA Build:
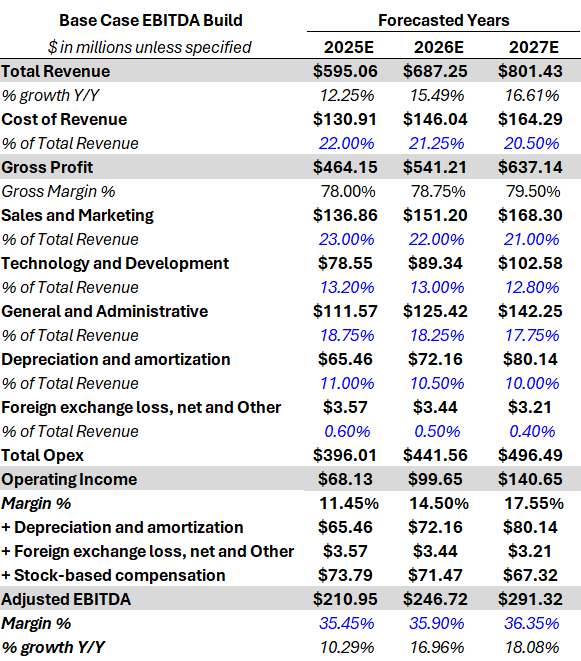
No key changes here, except for increased EBITDA $ growth driven by higher revenue and operating leverage as opex marginally declines as a % of revenue. I continue to expect management to meet gross-margin targets, capture S&M efficiency gains, and manage G&A spend conservatively as they hire.
Updated Price Target
Given the solid 1Q25 outperformance and the long-term thesis tracking well, I am nudging my 2026 PT higher—but only marginally, as macro visibility remains limited. I still view a 9x EV/adj. EBITDA multiple as fair on post-FY26 results.

In a bear-case scenario—if the shift to performance stalls, supply–demand dynamics fail to lift Measurement CPMs in an impression downturn, advertiser uncertainty persists through FY26, and macro pressures weigh on the already conservative FY25 guide—I see IAS generating just $176.6M in FY26E EBITDA. Applying an unprecedented 5x multiple yields a bear-case 2026 PT of $6.51, or -20% downside.
Despite exposure to macro uncertainty, I find the risk/reward attractive here. My bear case is almost draconian. At the current share price, the market appears to be pricing in an immediate disruption to IAS’s model—something I don’t see, given steady client wins and stable churn. IAS is better positioned than DV in pre-bid (Optimization), the key growth area as advertisers shift to performance. Moreover, its Publica SSP and broad international reach give IAS an edge in capturing CTV and global growth that DV lacks. Speculative catalysts—renewed private-equity interest and a potential boost from the Google ad-tech breakup—remain in play.
Disclaimer: Nothing posted by P14 Capital should be considered financial advice. The author of this post holds a long position in IAS. Please consult a financial advisor and/or conduct your own due diligence before making investment decisions.